Fig. 9
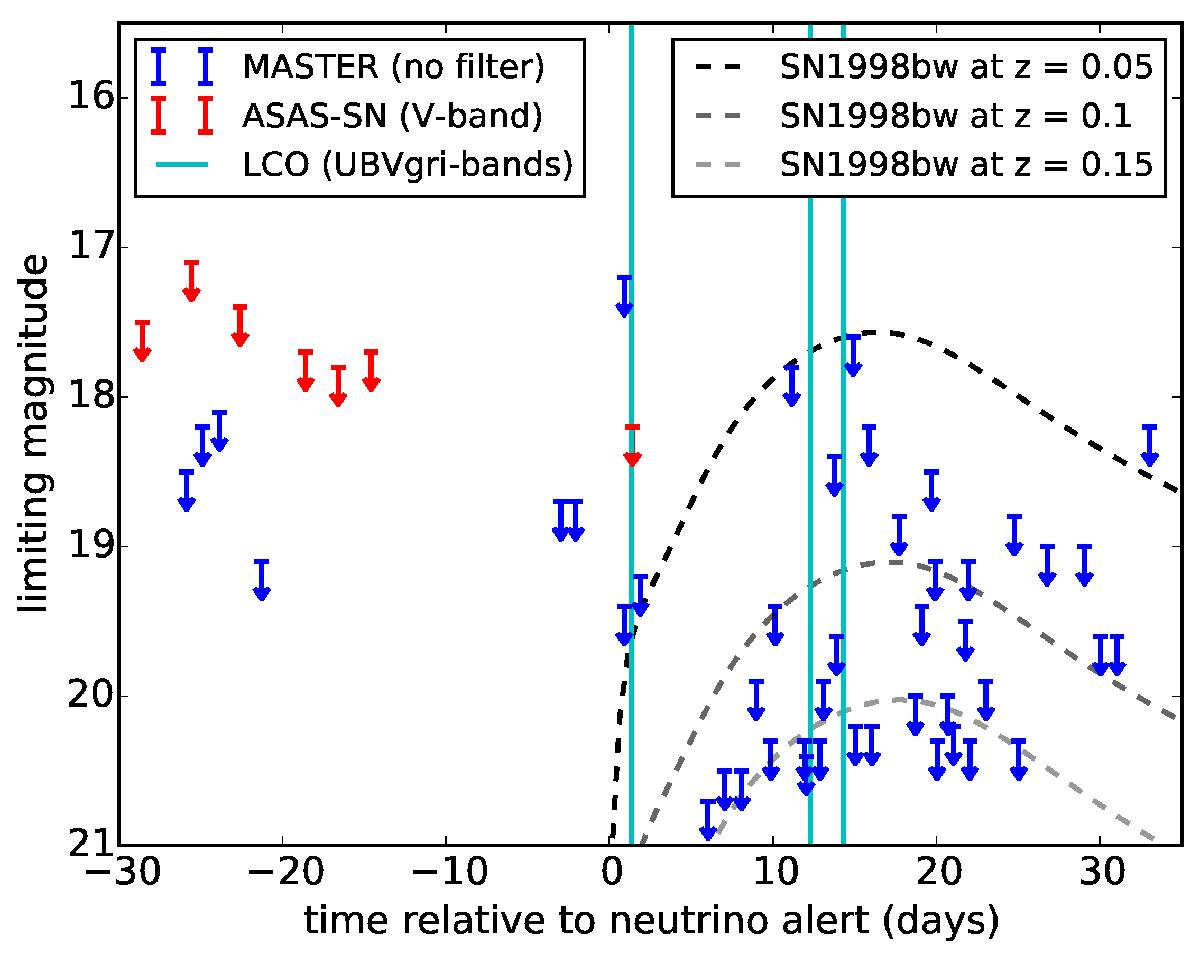
Optical 5σ limiting magnitudes from Table B.1 and described in Sect. 4.1. LCO epochs (from Table B.2) are shown as vertical lines. At these times, observations in the UBVgri bands were obtained, however no image subtraction was done. We overplot, as an example, the V-band light curve of SN 1998bw, which was associated with GRB 980425. The synthetic light curves of SN 1998bw have been created using the method presented in Cano (2014).
Current usage metrics show cumulative count of Article Views (full-text article views including HTML views, PDF and ePub downloads, according to the available data) and Abstracts Views on Vision4Press platform.
Data correspond to usage on the plateform after 2015. The current usage metrics is available 48-96 hours after online publication and is updated daily on week days.
Initial download of the metrics may take a while.