Fig. 1
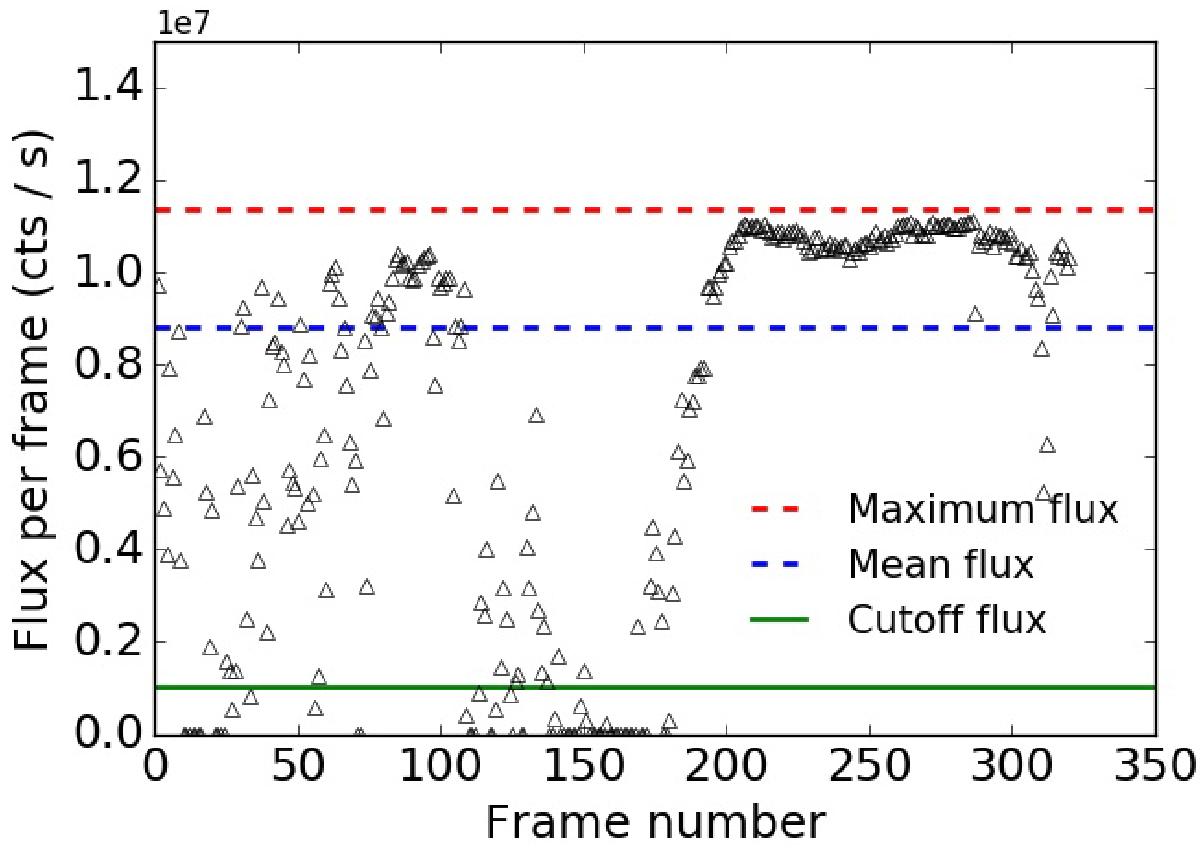
Total counts per second in the frames for the polarimetric observations of April 2015 illustrating the impact of clouds on the data. Essentially only frames with count rates above 1 × 10⁶ (green line) were used in the data reduction. The dashed lines mark the maximum counts per frame 1.14 × 10⁷ and the mean counts 8.6 × 10⁶ for the frames considered in the data analysis.
Current usage metrics show cumulative count of Article Views (full-text article views including HTML views, PDF and ePub downloads, according to the available data) and Abstracts Views on Vision4Press platform.
Data correspond to usage on the plateform after 2015. The current usage metrics is available 48-96 hours after online publication and is updated daily on week days.
Initial download of the metrics may take a while.