Fig. 9
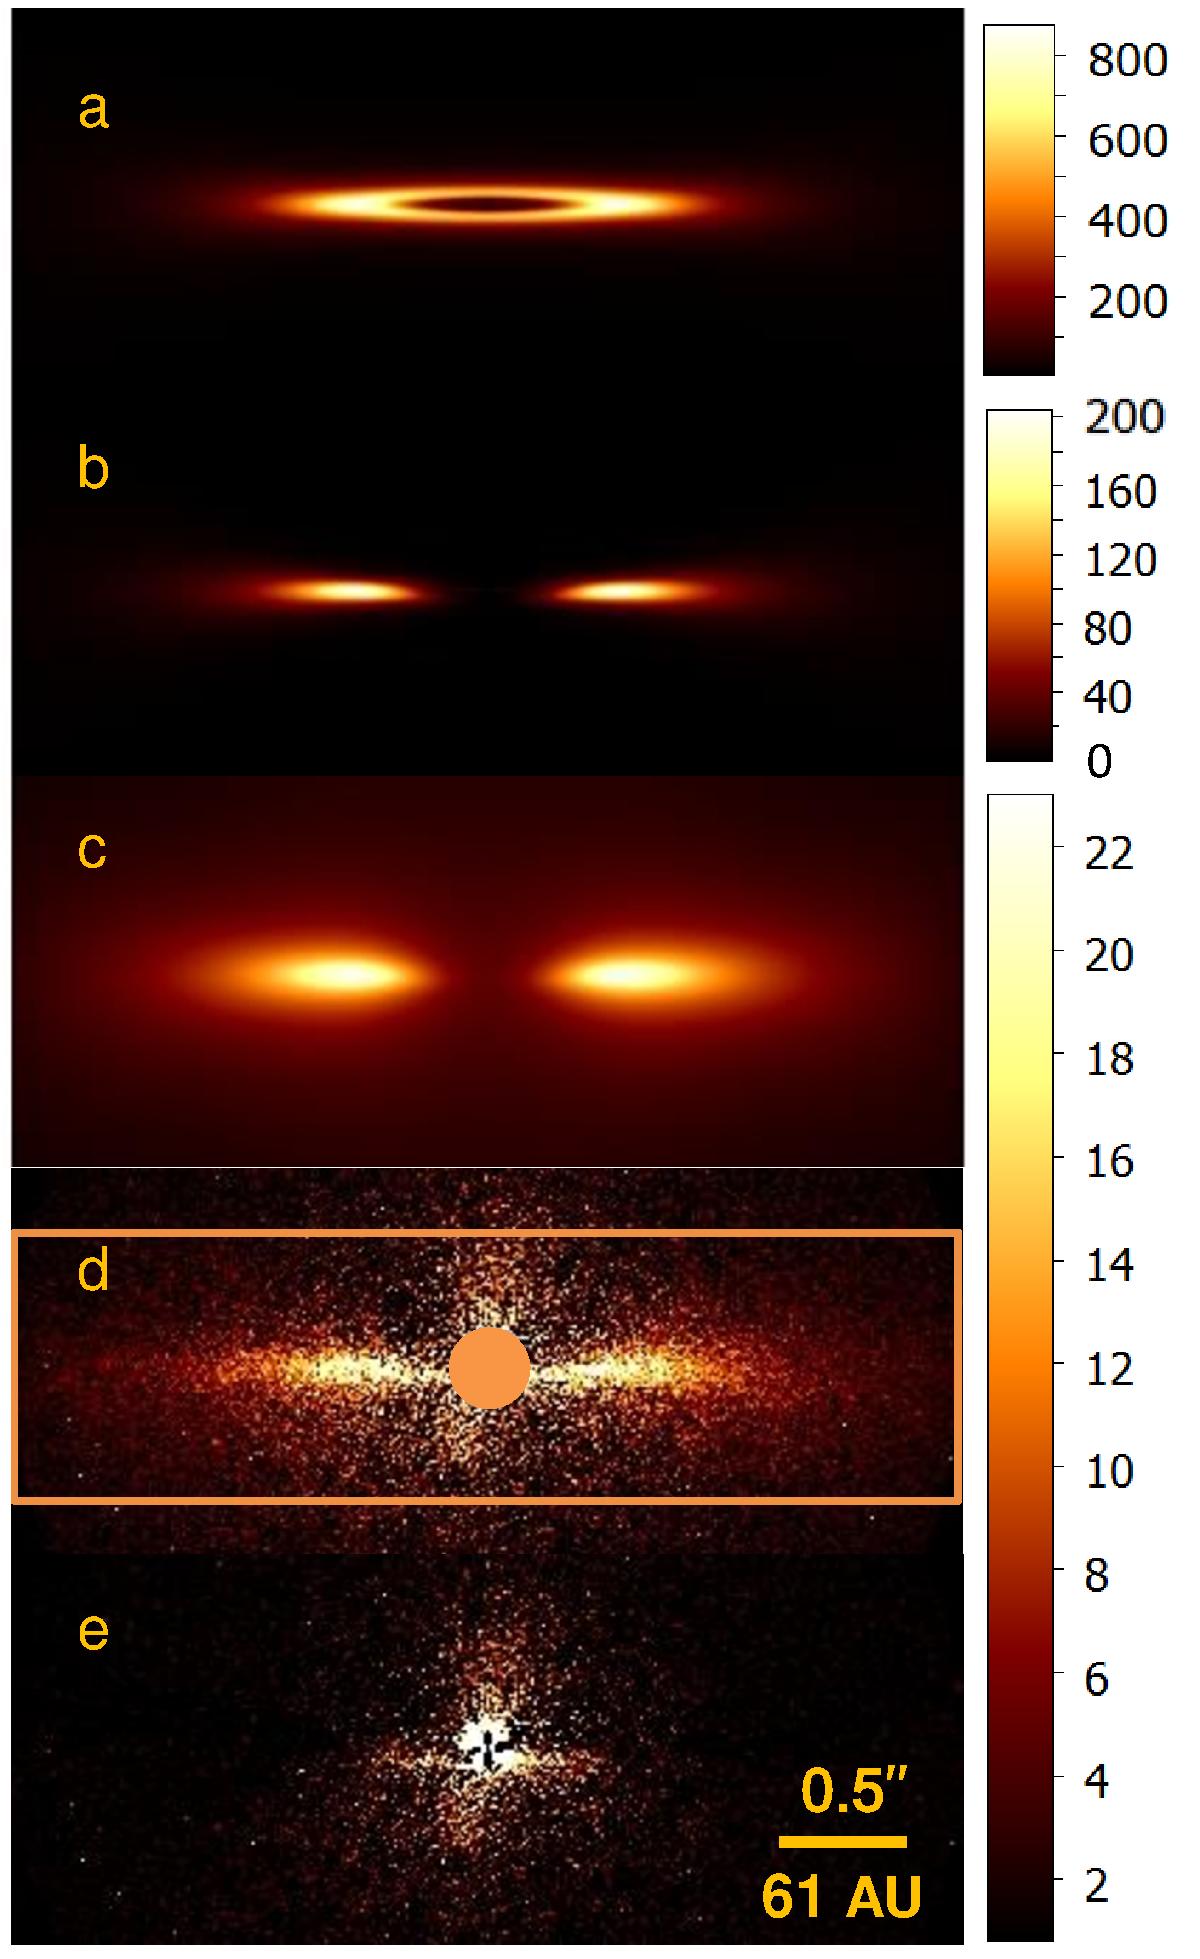
Comparison of the best-fit model with the Qϕ image. Panel a: Image visualizing the dust distribution in the disk. Panel b: Model image of the polarized light non-convolved with PSF. Panel c: Model image of the polarized light convolved with the instrumental PSF. Panel d: Qϕ image from the data. The rectangular area outlined with an orange box shows the minimization window as described in the body text. The orange circle marks the central region of the image excluded from the χ2 evaluation. Panel e: Residual image obtained after subtraction of the PSF-convolved model image (c) from the Qϕ image (d). Color-scales of images (a) and (b) are given in arbitrary units. The color-bar for images (c, d) and (e) shows polarized flux in counts per binned pixel.
Current usage metrics show cumulative count of Article Views (full-text article views including HTML views, PDF and ePub downloads, according to the available data) and Abstracts Views on Vision4Press platform.
Data correspond to usage on the plateform after 2015. The current usage metrics is available 48-96 hours after online publication and is updated daily on week days.
Initial download of the metrics may take a while.