Fig. 2
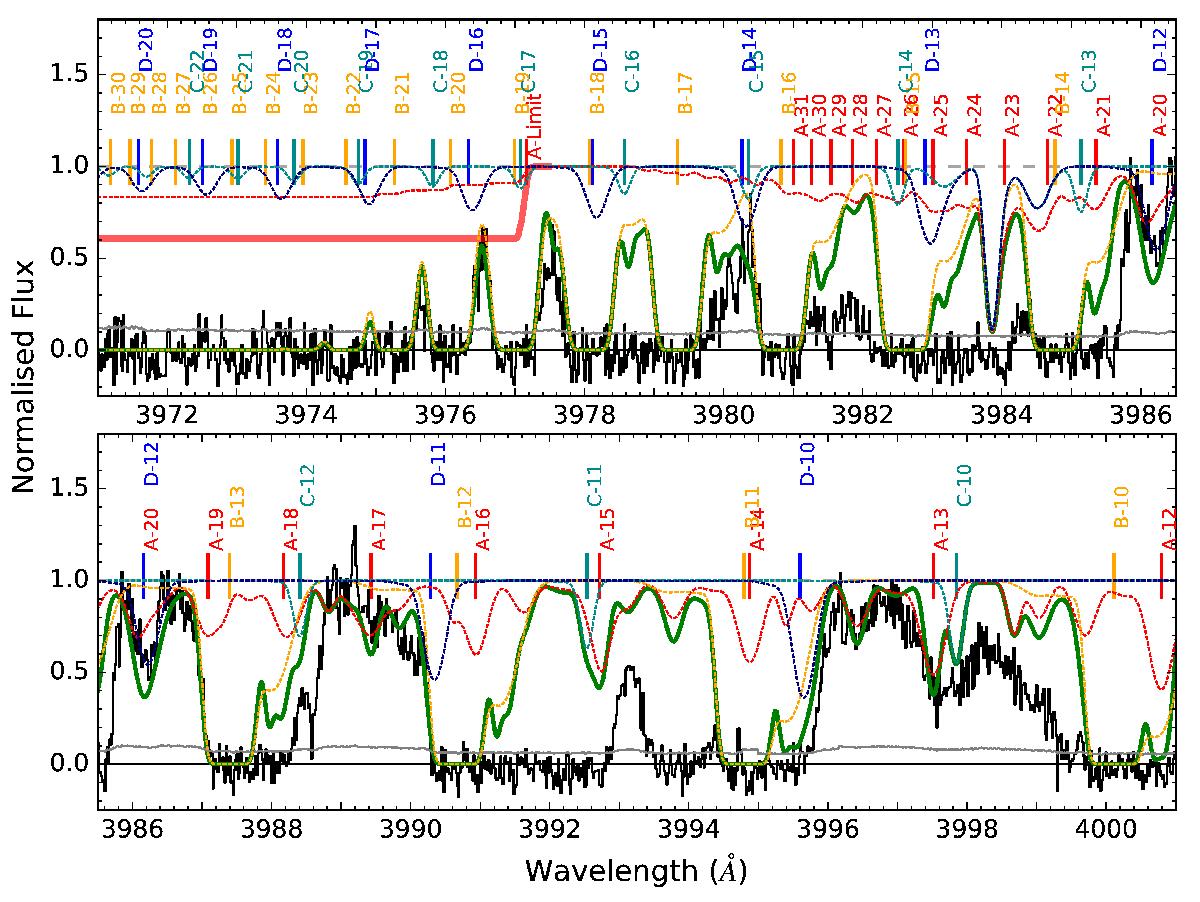
Normalised HIRES spectrum of GRB 080810 (black) around the Lyman limit of 911.8 Å. Fits to the absorption by H i by the four systems of the host are plotted as dashed lines in red, orange, cyan, and dark blue for systems A–D, respectively, with the combined fit shown in solid green. Labels show the location of each order for each component. The error spectrum is shown in grey. The thick red line corresponds to the upper limit in system A of NH i ≤ 16.9.
Current usage metrics show cumulative count of Article Views (full-text article views including HTML views, PDF and ePub downloads, according to the available data) and Abstracts Views on Vision4Press platform.
Data correspond to usage on the plateform after 2015. The current usage metrics is available 48-96 hours after online publication and is updated daily on week days.
Initial download of the metrics may take a while.