Fig. 3
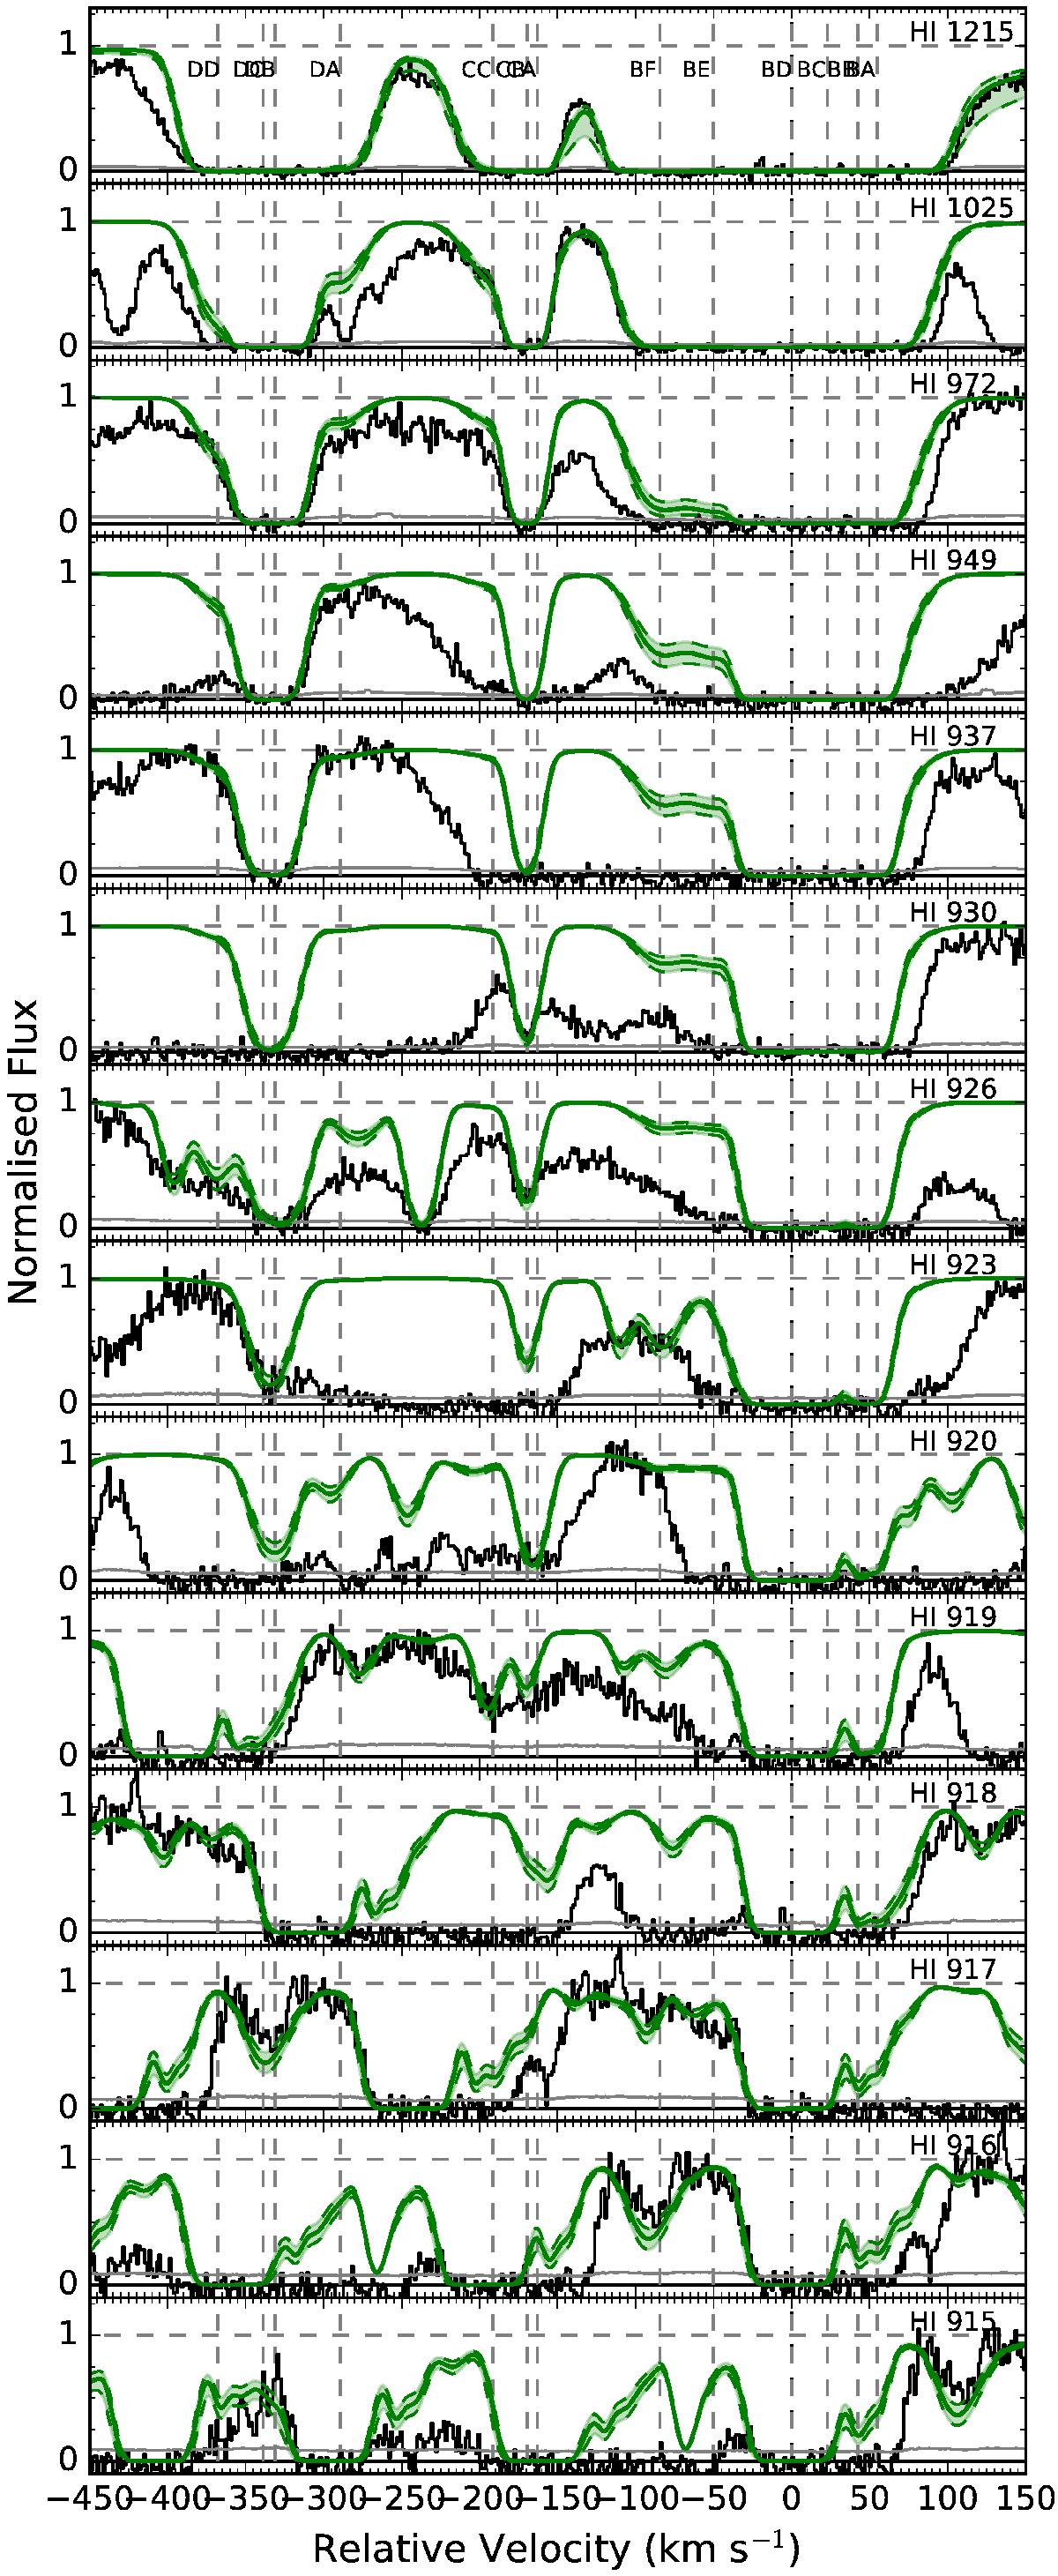
Selection of fits to the Lyman series for systems D, C, and B at z = 3.346, 3.348, and 3.351, respectively. Lines between the third and tenth orders allow systems C and D to be constrained well. Higher order Lyman-series transitions near the Lyman limit, where system B better is constrained, are shown in Fig. 2. Shaded regions show 0.3 dex deviations from the best fit. Grey vertical lines represent the centres of the corresponding components.
Current usage metrics show cumulative count of Article Views (full-text article views including HTML views, PDF and ePub downloads, according to the available data) and Abstracts Views on Vision4Press platform.
Data correspond to usage on the plateform after 2015. The current usage metrics is available 48-96 hours after online publication and is updated daily on week days.
Initial download of the metrics may take a while.