Fig. 11
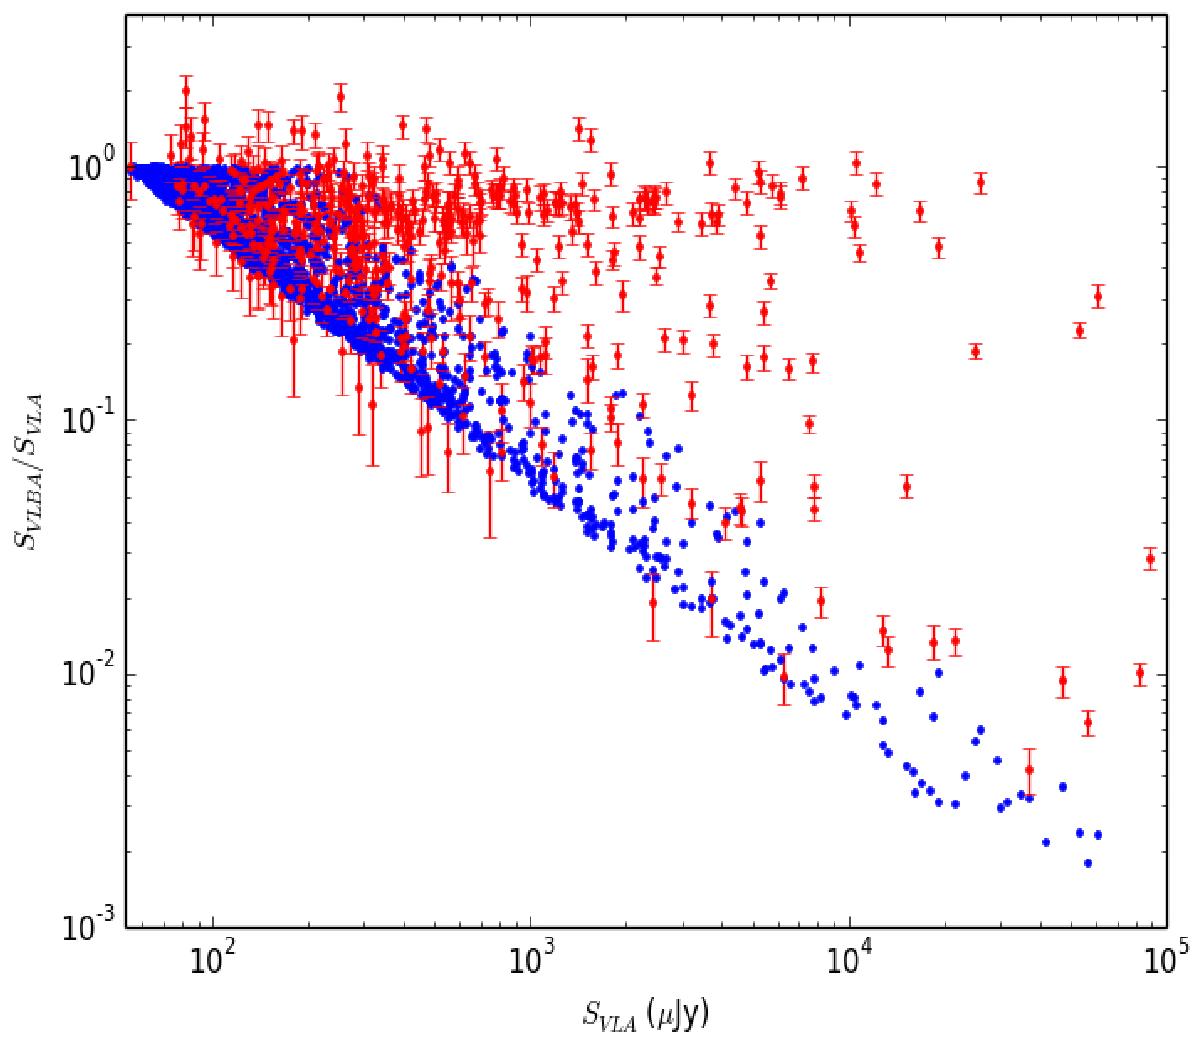
VLBA-VLA flux density ratio. The blue dots represent upper limits for the VLA sources from the input catalogue. Their VLBA-VLA flux density ratios have been computed as 5.5 × rmsVLBA/SVLA, where rmsVLBA is the rms noise of the VLBA naturally-weighted image (since we used the natural weighting for source detection), and SVLA is the integrated VLA flux density of the source. The red dots with error bars represent the VLBA detected sources.
Current usage metrics show cumulative count of Article Views (full-text article views including HTML views, PDF and ePub downloads, according to the available data) and Abstracts Views on Vision4Press platform.
Data correspond to usage on the plateform after 2015. The current usage metrics is available 48-96 hours after online publication and is updated daily on week days.
Initial download of the metrics may take a while.