Free Access
Fig. 13
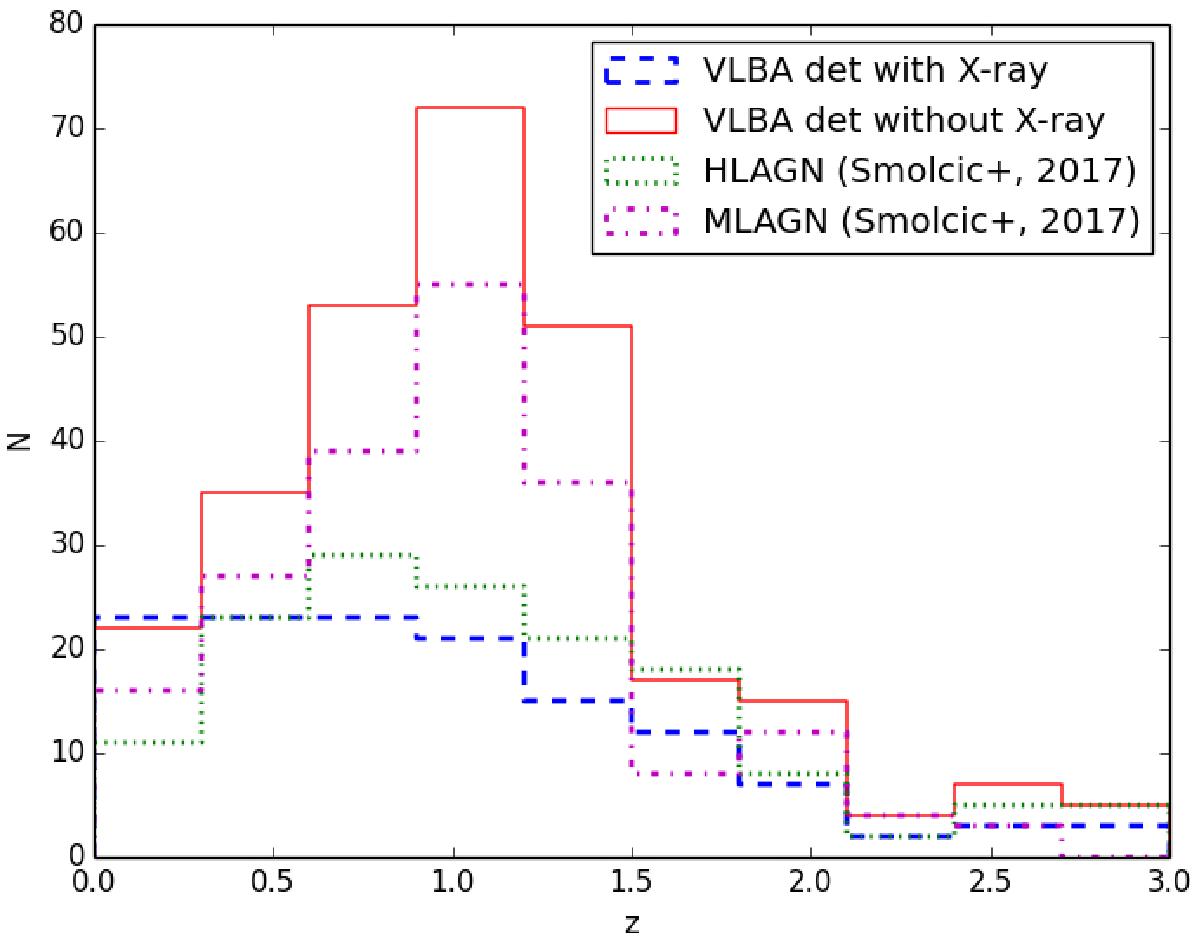
Redshift distribution of the VLBA detected sources with X-ray counterparts (dashed blue line) and without X-ray counterparts (solid red line). The VLBA detected sources classified either as HLAGN or as MLAGN by Smolčić et al. (2017b) are represented by the dotted green line (HLAGN) and the dash-dotted magenta line (MLAGN).
Current usage metrics show cumulative count of Article Views (full-text article views including HTML views, PDF and ePub downloads, according to the available data) and Abstracts Views on Vision4Press platform.
Data correspond to usage on the plateform after 2015. The current usage metrics is available 48-96 hours after online publication and is updated daily on week days.
Initial download of the metrics may take a while.