Fig. 14
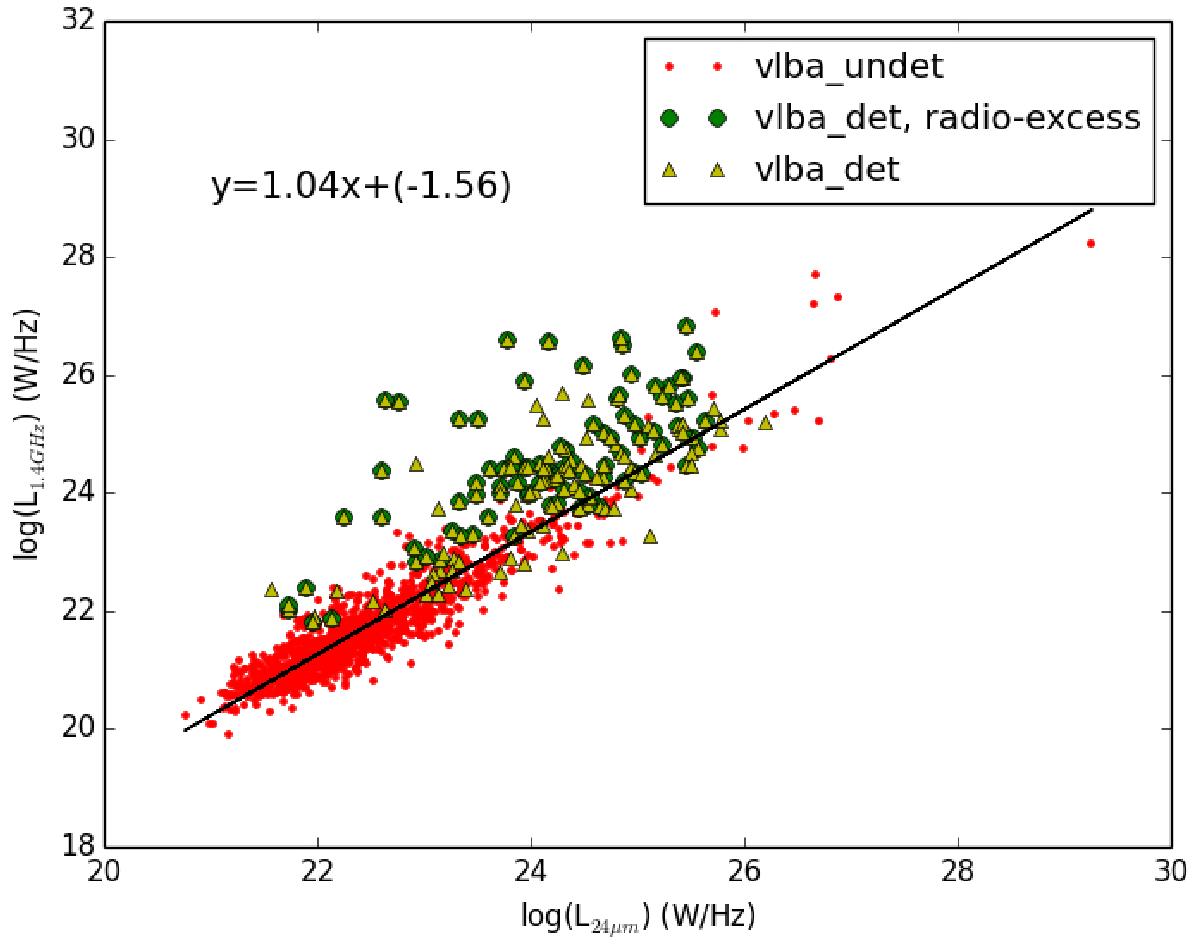
Radio (1.4 GHz) – infrared (24 μm) correlation of the sample, showing the VLBA detected sources classified as radio-excess sources by Smolčić et al. (2017b; see text for details). The VLA flux densities have been used for all the plotted sources. The red dots represent the VLBA undetected sources. The yellow triangles represent the VLBA detected sources. The green circles represent the VLBA detected sources classified as radio-excess sources by Smolčić et al. (2017b). The black line represents the linear regression fitting the VLBA undetected sources.
Current usage metrics show cumulative count of Article Views (full-text article views including HTML views, PDF and ePub downloads, according to the available data) and Abstracts Views on Vision4Press platform.
Data correspond to usage on the plateform after 2015. The current usage metrics is available 48-96 hours after online publication and is updated daily on week days.
Initial download of the metrics may take a while.