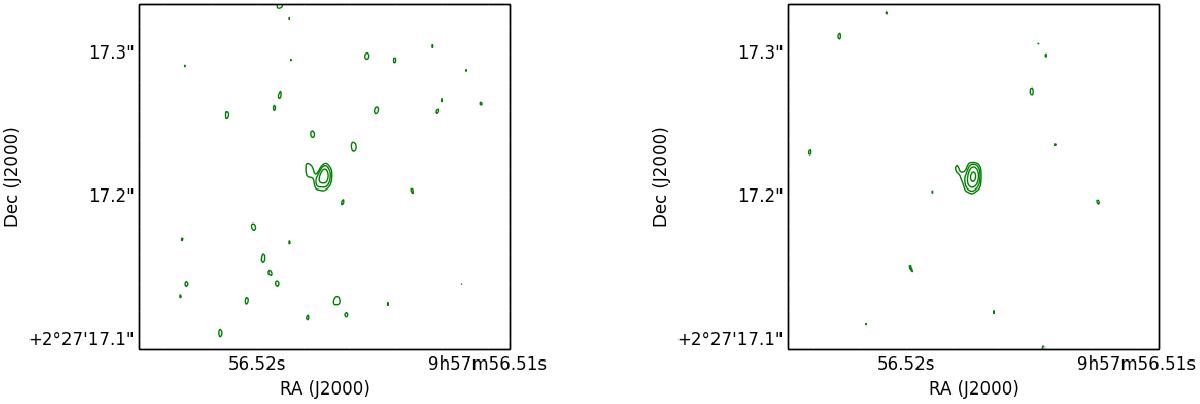
Fig. 2

Contour plots of a target before applying multi-source self-calibration (left) and after applying multi-source self-calibration (right). The peak flux density of the left panel image is 1.2 mJy and the rms is 58 μJy. The peak flux density of the right panel image is 1.6 mJy and the rms is 55 μJy. Positive contours start at three times the rms level of the image and increase by a factor of two. The image is uniformly-weighted. The peak flux density has increased and the sidelobe level is reduced.
Current usage metrics show cumulative count of Article Views (full-text article views including HTML views, PDF and ePub downloads, according to the available data) and Abstracts Views on Vision4Press platform.
Data correspond to usage on the plateform after 2015. The current usage metrics is available 48-96 hours after online publication and is updated daily on week days.
Initial download of the metrics may take a while.


