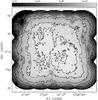
Fig. 3
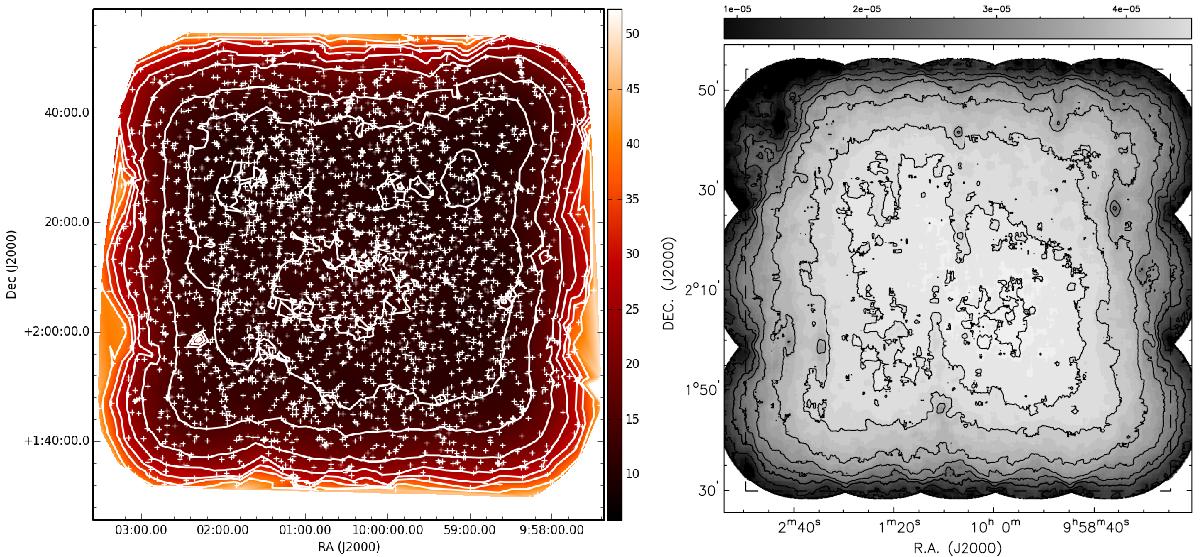
Left panel: sensitivity map of the VLBA-COSMOS project. The colour bar represents the rms noise values in μJy/beam. The white crosses show the target positions. White contours are drawn at 10, 12, 15, 20, 25, 30, 34, and 40 μJy/beam to match the contours in the VLA image. Right panel: Fig. 4 from Schinnerer et al. (2010), representing the sensitivity map of the VLA-COSMOS Deep project. The contours correspond to rms levels of 10, 12, 15, 20, 25, 30, 34, and 40 μJy/beam. We can see that the rms distribution of the two images is in excellent agreement.

Current usage metrics show cumulative count of Article Views (full-text article views including HTML views, PDF and ePub downloads, according to the available data) and Abstracts Views on Vision4Press platform.
Data correspond to usage on the plateform after 2015. The current usage metrics is available 48-96 hours after online publication and is updated daily on week days.
Initial download of the metrics may take a while.