Free Access
Fig. 8
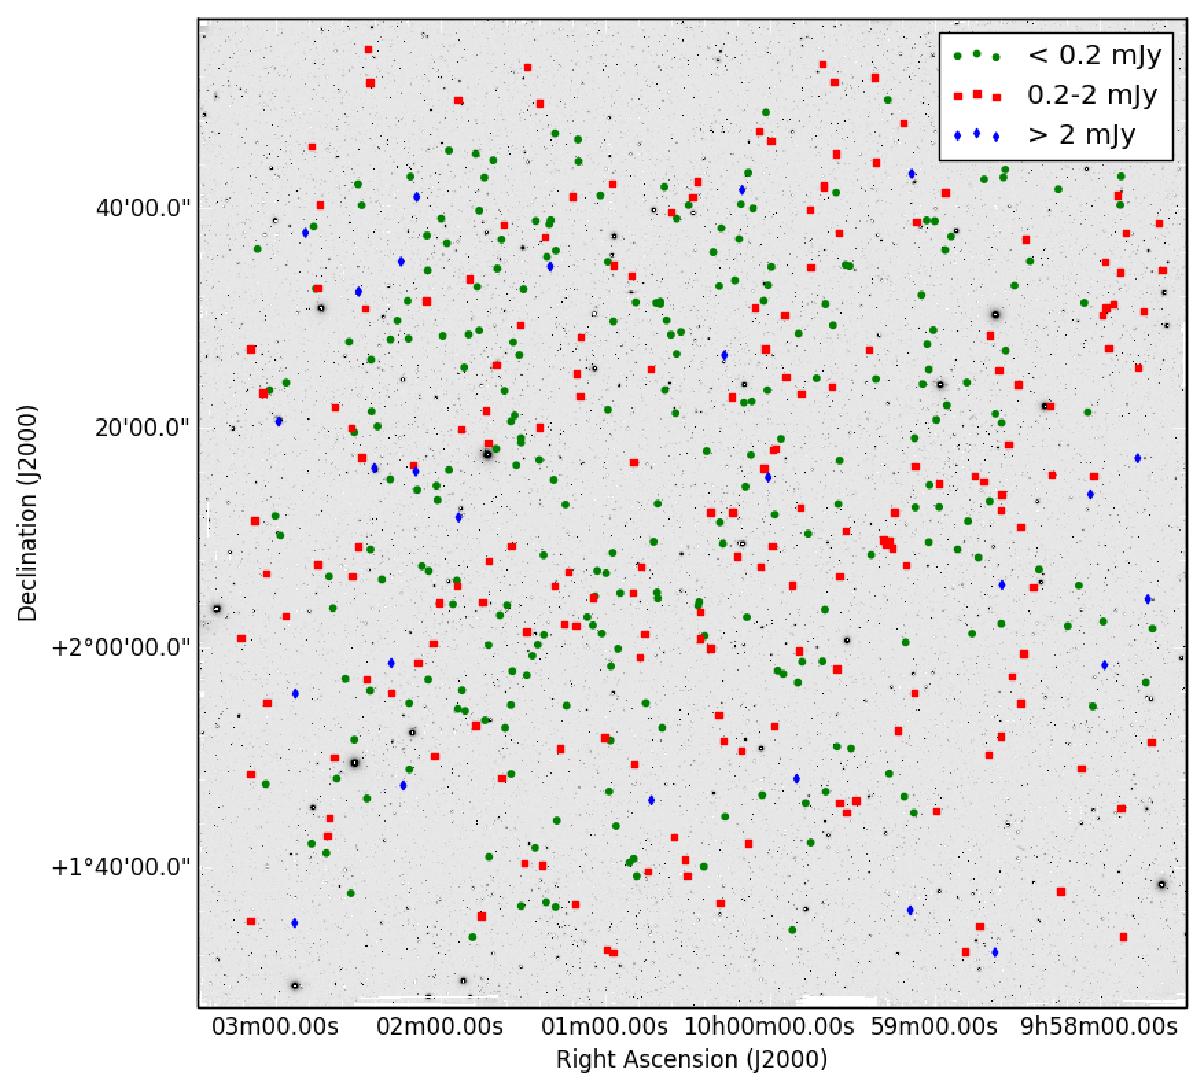
Distribution of the 468 VLBA detected sources over the COSMOS field. The green circles, red squares and blue diamonds represent VLBA detections with Sint< 0.2 mJy, 0.2 mJy < Sint< 2 mJy and Sint> 2 mJy, respectively. The background greyscale image is a mosaic of the COSMOS Subaru i-band data.
Current usage metrics show cumulative count of Article Views (full-text article views including HTML views, PDF and ePub downloads, according to the available data) and Abstracts Views on Vision4Press platform.
Data correspond to usage on the plateform after 2015. The current usage metrics is available 48-96 hours after online publication and is updated daily on week days.
Initial download of the metrics may take a while.