Fig. 9
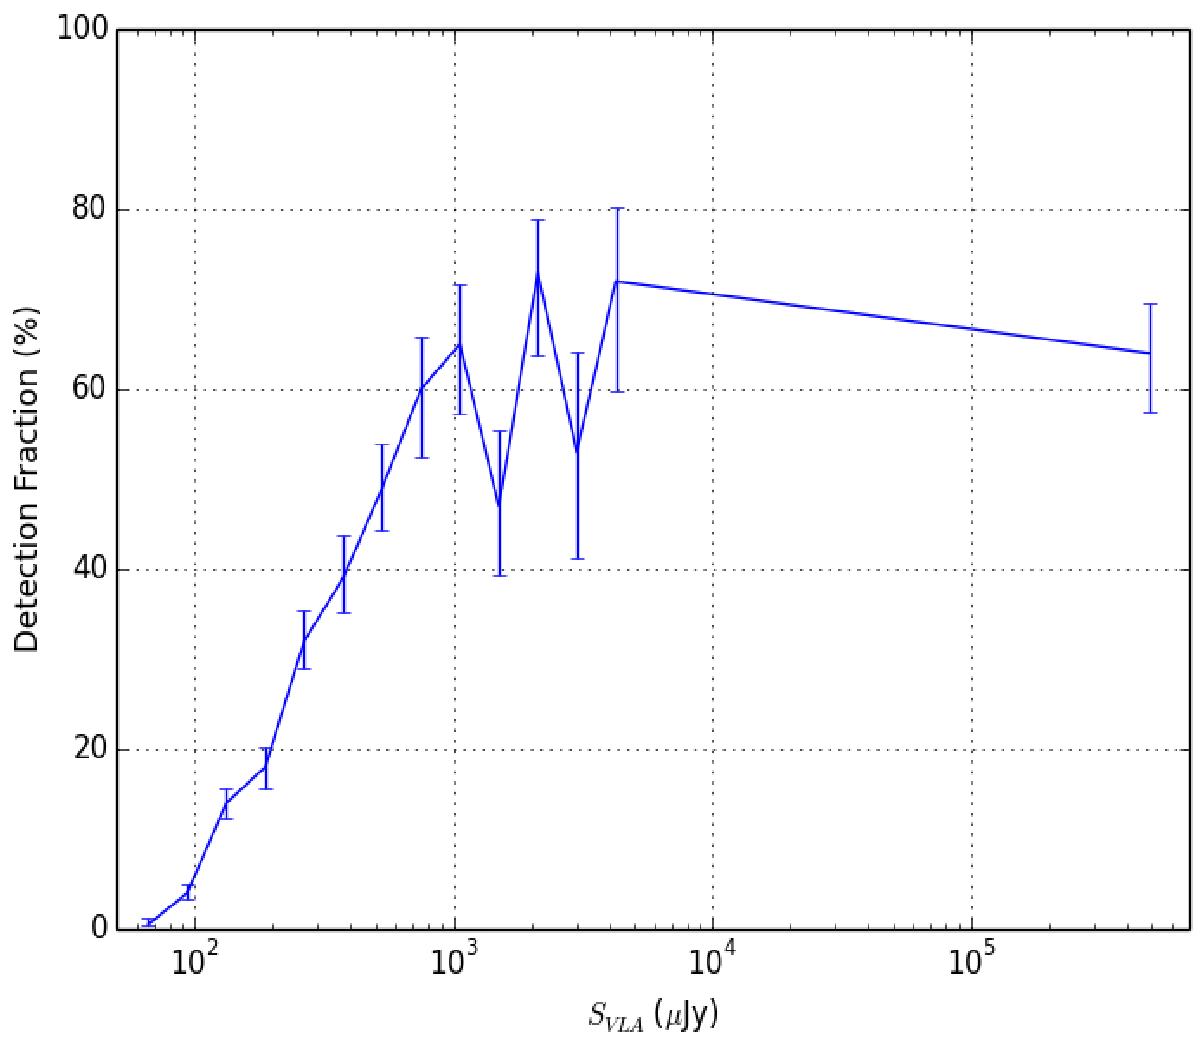
VLBA detection fraction as a function of SVLA. Only the VLBA detectable sources have been considered to compute this fraction. The VLA flux densities have been separated into bins corresponding to 55μJy × ![]() , where N = 0, 1, 2, ... The error bars have been calculated using the Bayesian technique for binomial populations as described by Cameron (2011, 1σ confidence interval).
, where N = 0, 1, 2, ... The error bars have been calculated using the Bayesian technique for binomial populations as described by Cameron (2011, 1σ confidence interval).
Current usage metrics show cumulative count of Article Views (full-text article views including HTML views, PDF and ePub downloads, according to the available data) and Abstracts Views on Vision4Press platform.
Data correspond to usage on the plateform after 2015. The current usage metrics is available 48-96 hours after online publication and is updated daily on week days.
Initial download of the metrics may take a while.