Fig. 9
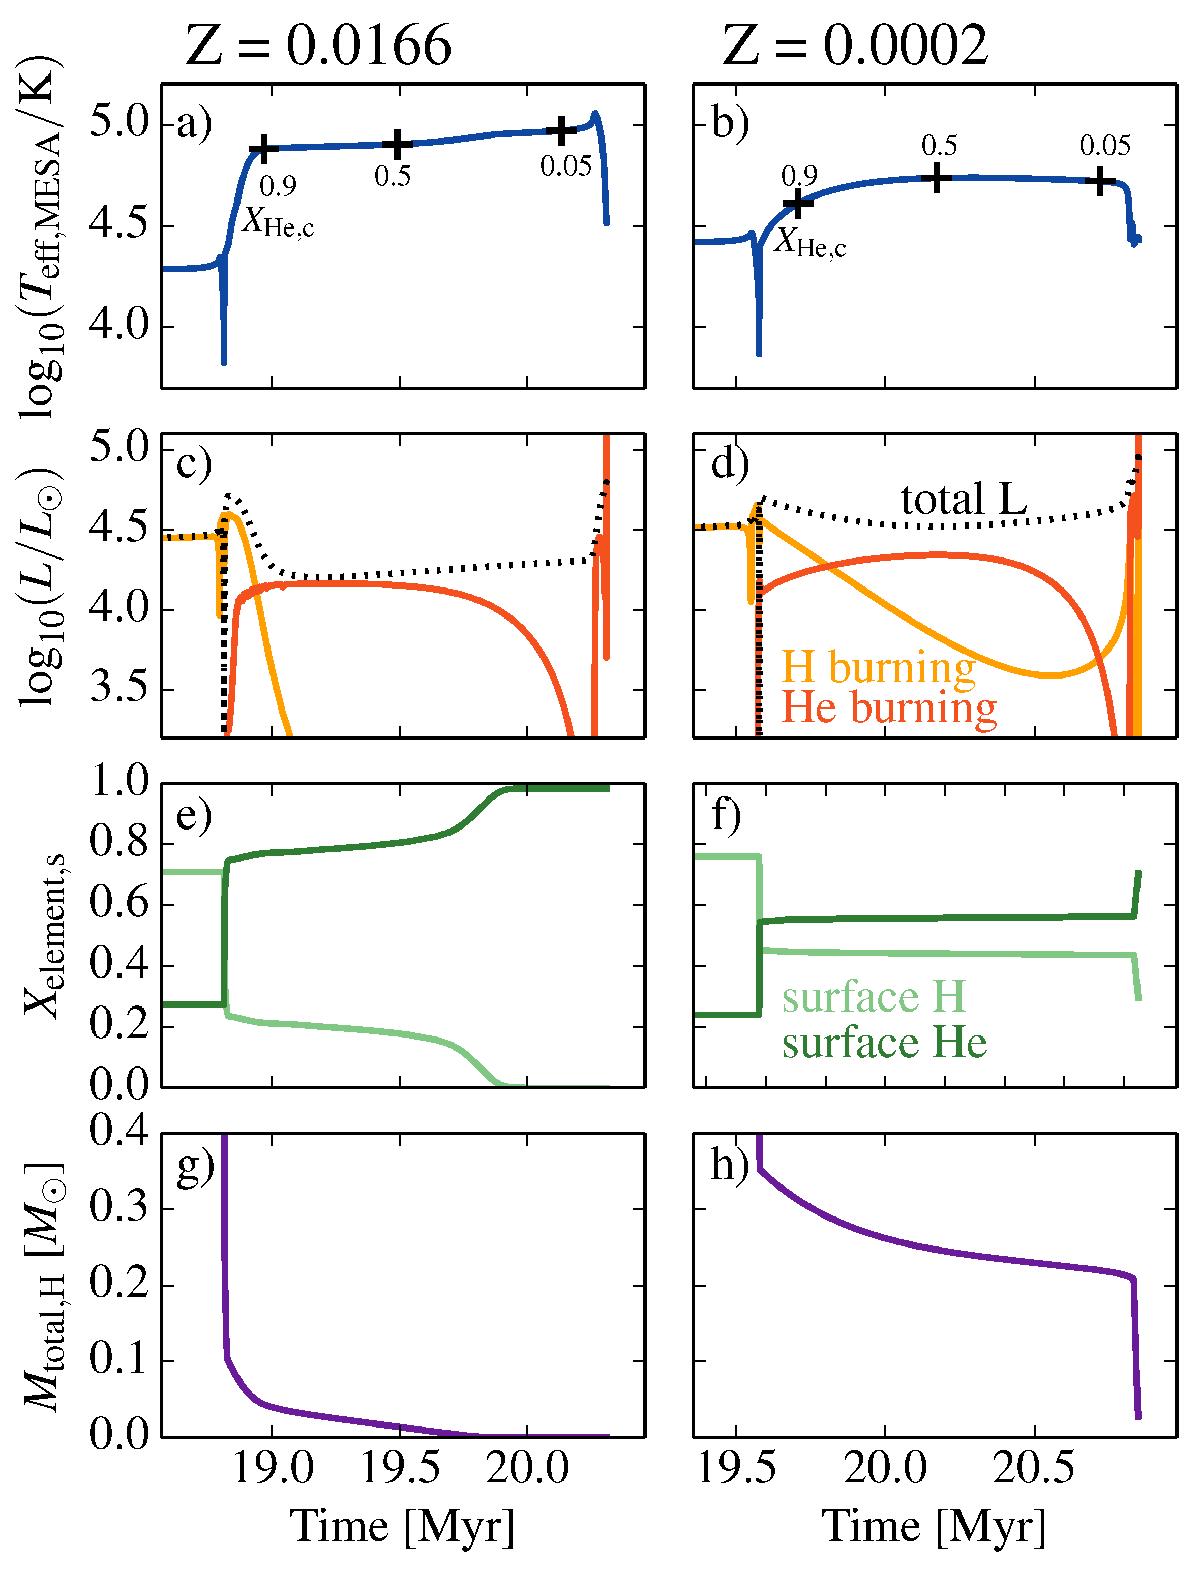
Effective temperature (panels a and b), luminosity from hydrogen and helium burning (panels c and d), surface mass fraction of hydrogen and helium (panels e and f) and total mass of hydrogen (panels g and h) for our Z = 0.0166 (left column) and Z = 0.0002 (right column) models from slightly before Roche-lobe overflow and for the rest of the evolution. In the panels with effective temperature plus signs indicate the times at which the central helium mass fraction has reached 0.9, 0.5 and 0.05. In the luminosity panels we show the total stellar luminosity with a black, dotted line.
Current usage metrics show cumulative count of Article Views (full-text article views including HTML views, PDF and ePub downloads, according to the available data) and Abstracts Views on Vision4Press platform.
Data correspond to usage on the plateform after 2015. The current usage metrics is available 48-96 hours after online publication and is updated daily on week days.
Initial download of the metrics may take a while.