Fig. 3
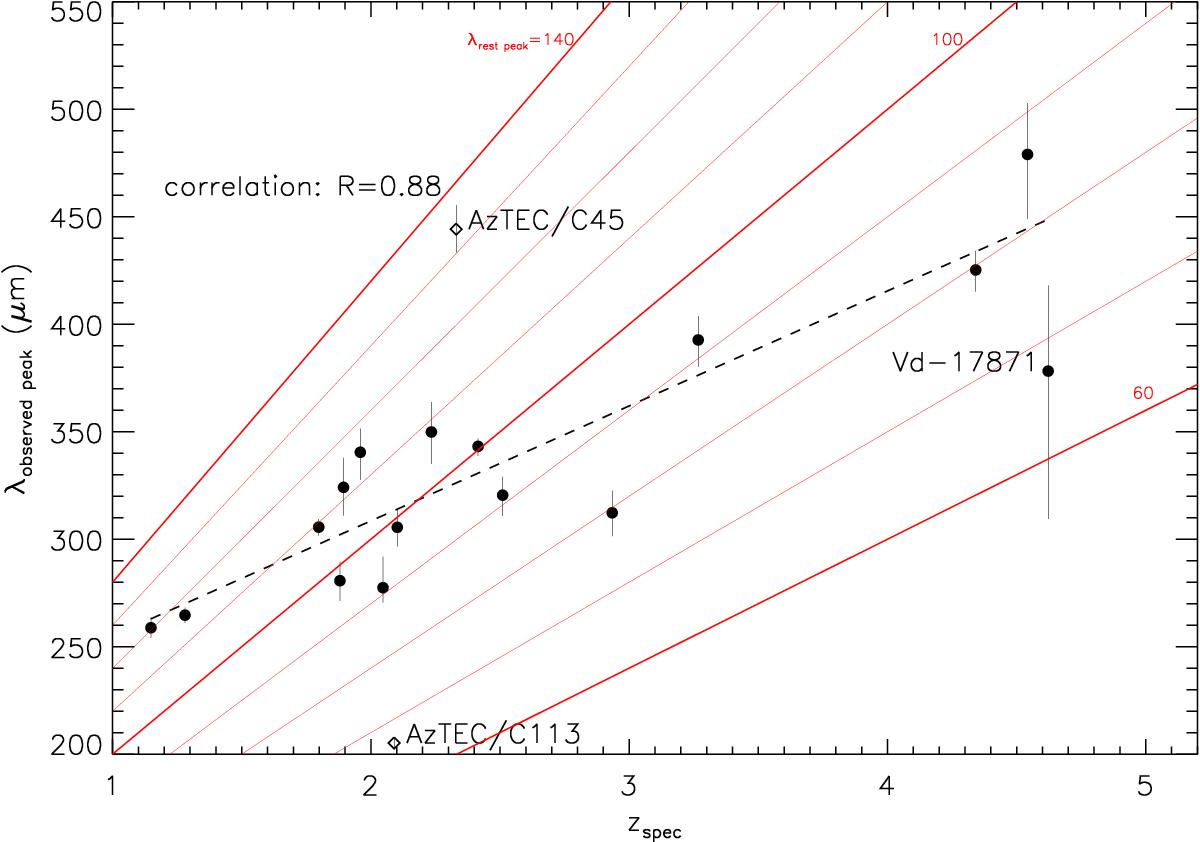
Parabolic-fitted peak wavelength, λobserved peak, vs. zspec for the sources in our zFIR training set. AzTEC/C113 and AzTEC/C45 are plotted although they were not used in our training set since they are extreme outliers. The source Vd-17871 is included in the training set since it fits our training set selection criteria and is a similar COSMOS field SMG (Smolčić et al. 2015). The fitted correlation z = m × λpeak + b is shown as a dashed line. Tracks of constant rest wavelength are overlaid as red lines progressing in intervals of 10 μm from λrest peak = 60μm in the lower right to 140 μm in the upper left.
Current usage metrics show cumulative count of Article Views (full-text article views including HTML views, PDF and ePub downloads, according to the available data) and Abstracts Views on Vision4Press platform.
Data correspond to usage on the plateform after 2015. The current usage metrics is available 48-96 hours after online publication and is updated daily on week days.
Initial download of the metrics may take a while.