Fig. 7
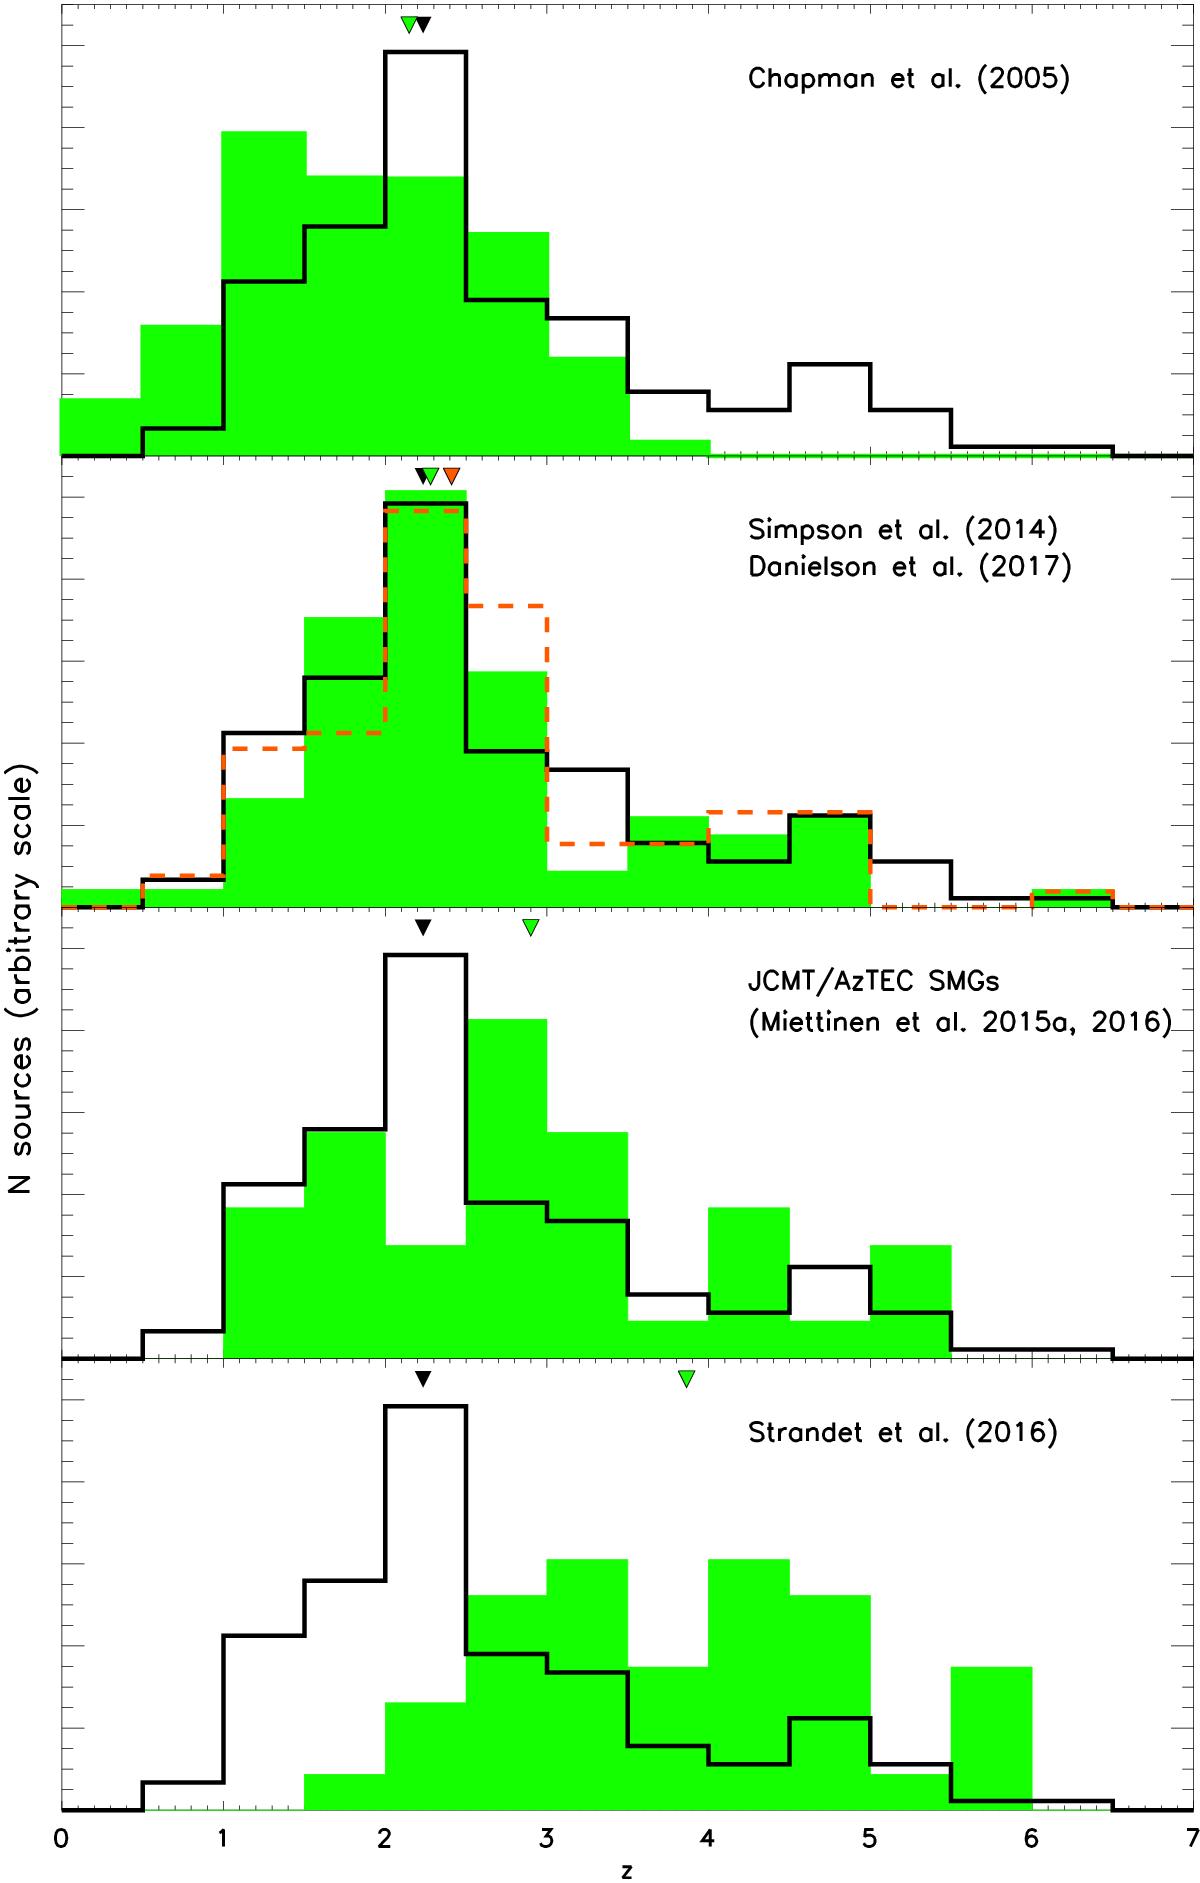
Redshift distribution of our extended sample (solid black line) compared to previous SMG surveys (green filled histograms). From top to bottom: Chapman et al. (2005, corrected for redshift desert using SMGs from Banerji et al. 2011), Simpson et al. (2014) as well as the updated ALESS sample from Danielson et al. (2017, orange dashed histogram), JCMT/AzTEC SMGs (revised from Miettinen et al. 2015a, 2017a), Strandet et al. (2016). Histograms have been normalized by their sample size such that each histogram contains equal area. Median values for each distribution are indicated by triangles above the distributions. (Here we use our observed median redshift ![]() rather than the median calculated from the redshift density likelihood function to compare directly to the other surveys’ observed medians.)
rather than the median calculated from the redshift density likelihood function to compare directly to the other surveys’ observed medians.)
Current usage metrics show cumulative count of Article Views (full-text article views including HTML views, PDF and ePub downloads, according to the available data) and Abstracts Views on Vision4Press platform.
Data correspond to usage on the plateform after 2015. The current usage metrics is available 48-96 hours after online publication and is updated daily on week days.
Initial download of the metrics may take a while.