Fig. 9
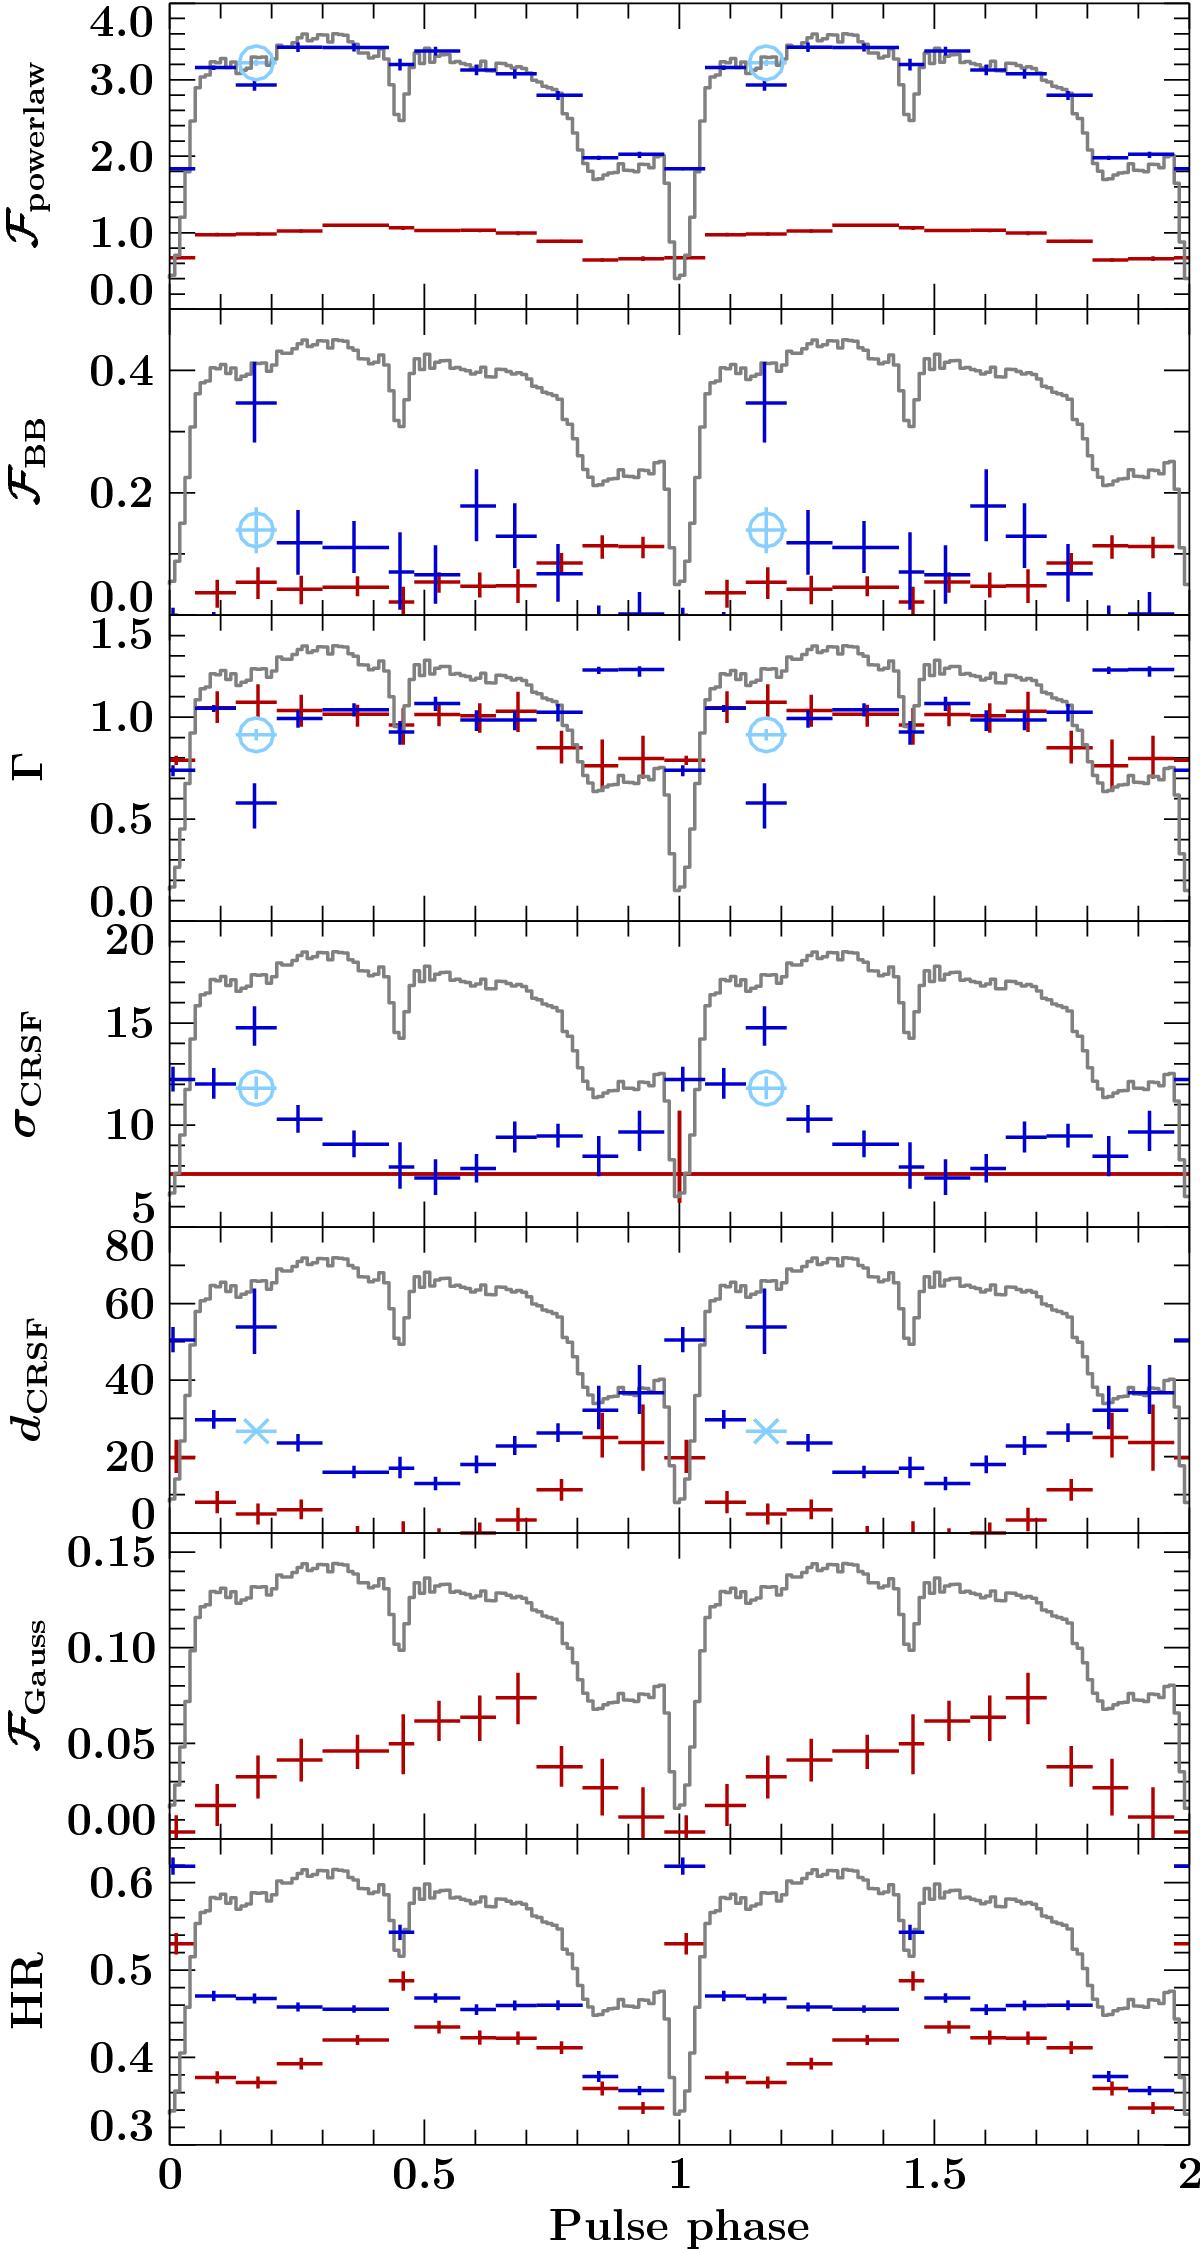
Evolution of some fit parameters over pulse phase for Obs. I (blue) and Obs. II (red). The models used were CutoffPL for Obs. I and CutoffPL + Gauss for Obs. II. The width of the CSRF could not be constrained for individual pulse phases for Obs. II and was therefore kept global. The last panel shows the hardness ratio of the individual phase-resolved spectra, defined as the count rate ratio of the 15–50 keV band divided by the 4–7 keV band. The gray curve shows the 3–78 keV pulse profile of Obs. I to illustrate the selection of the phase intervals. Pulse profile and parameter evolution are shown twice for clarity. All fluxes are given in units of 10-9 erg s-1 cm-2 and the cyclotron line width σCRSF in keV. The light blue data points in phase interval 0.13–0.21 show an alternative fit where the depth of the CRSF was fixed to the mean value of the two neighboring bins, but all global parameters were kept the same.
Current usage metrics show cumulative count of Article Views (full-text article views including HTML views, PDF and ePub downloads, according to the available data) and Abstracts Views on Vision4Press platform.
Data correspond to usage on the plateform after 2015. The current usage metrics is available 48-96 hours after online publication and is updated daily on week days.
Initial download of the metrics may take a while.