Fig. 4
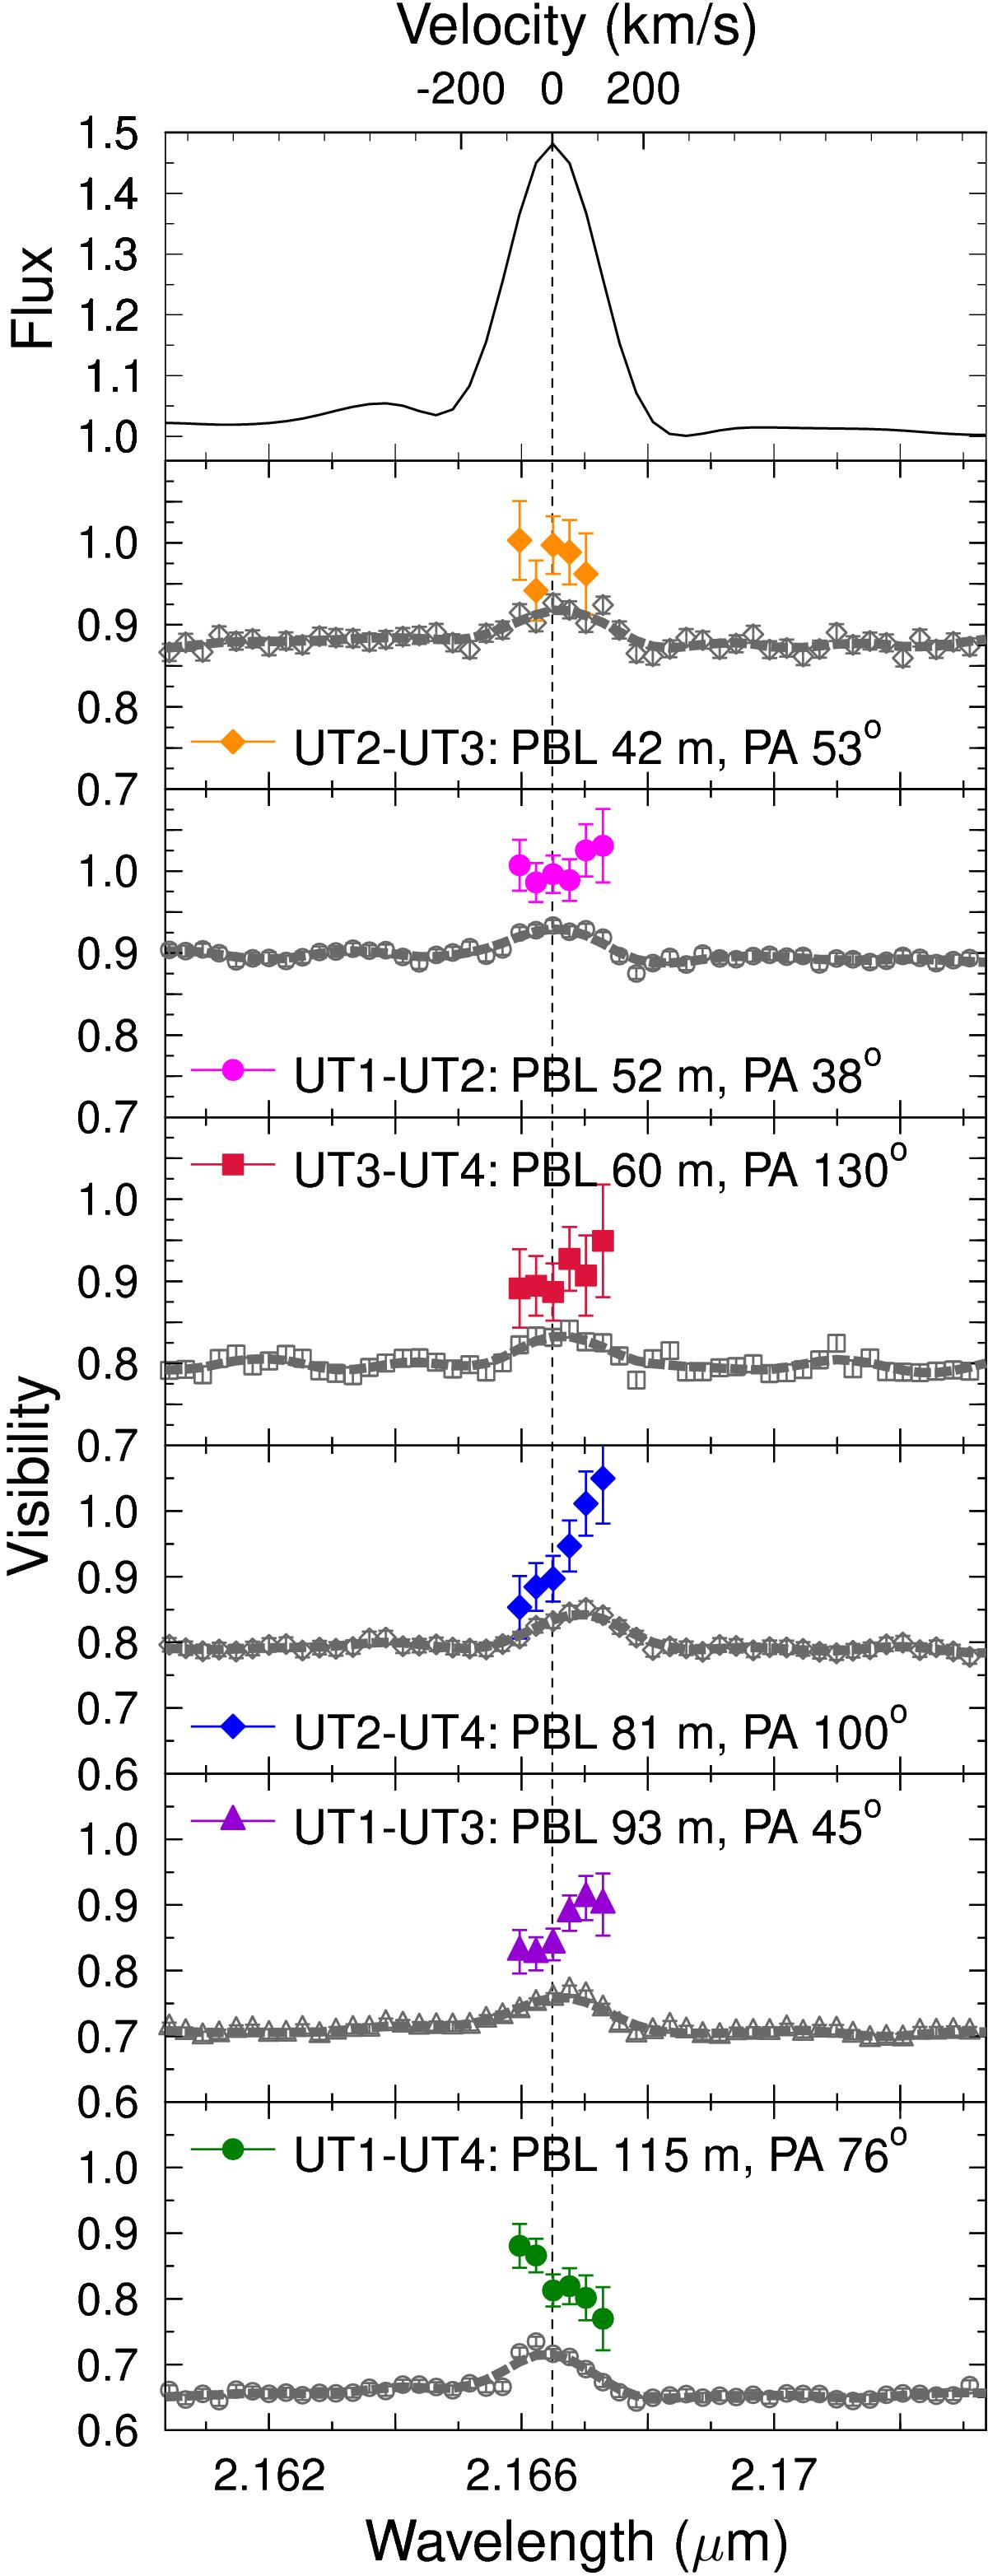
S CrA N continuum-compensated pure Brγ line visibilities (full coloured symbols) computed for each of the six GRAVITY baselines. As a reference, the Brγ line profile normalised to the continuum is displayed in the top panel. The wavelength dispersed visibility amplitudes are overplotted for each PBL (empty grey symbols), along with a spectral binning of the visibility amplitudes (solid grey line). Velocities are with respect to the LSR.
Current usage metrics show cumulative count of Article Views (full-text article views including HTML views, PDF and ePub downloads, according to the available data) and Abstracts Views on Vision4Press platform.
Data correspond to usage on the plateform after 2015. The current usage metrics is available 48-96 hours after online publication and is updated daily on week days.
Initial download of the metrics may take a while.