Free Access
Fig. 2
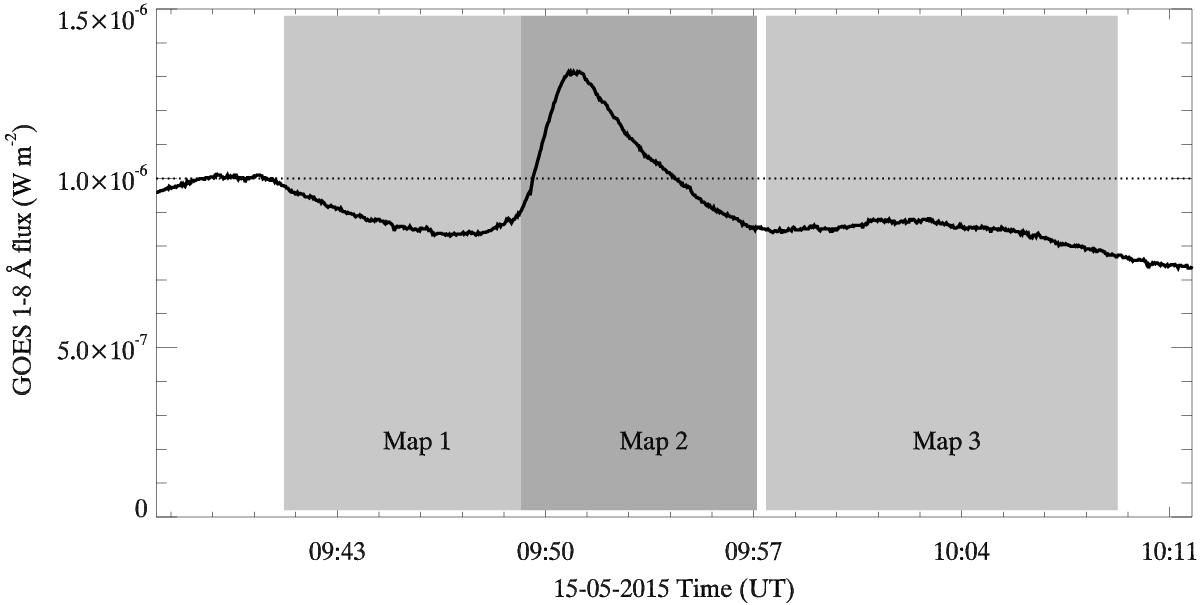
Temporal variation of GOES X-ray flux. The dotted horizontal line indicates the threshold for C-class flares. Gray shaded areas mark the time range of the three raster spectropolarimetric maps measured with GREGOR/GRIS.
Current usage metrics show cumulative count of Article Views (full-text article views including HTML views, PDF and ePub downloads, according to the available data) and Abstracts Views on Vision4Press platform.
Data correspond to usage on the plateform after 2015. The current usage metrics is available 48-96 hours after online publication and is updated daily on week days.
Initial download of the metrics may take a while.