Fig. 12
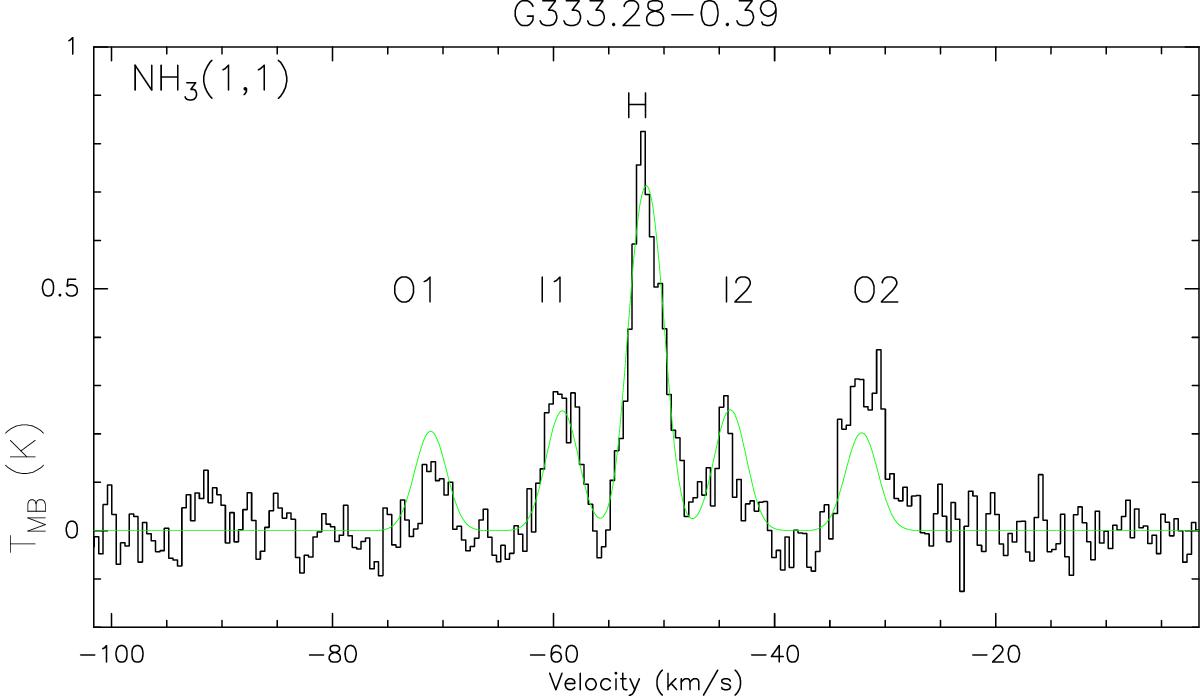
Example of observed NH3 (1, 1) hyperfine structure lines, the outer satellite lines are denoted by O1 and O2, the inner hyperfine lines by I1 and I2, and the main line by H. The NH3 hyperfine structure fit assuming LTE conditions is overlaid in green, which displays equal intensities of O1 and O2 as well as of I1 and I2. The outer satellite lines of the observed spectrum deviate from this prediction.
Current usage metrics show cumulative count of Article Views (full-text article views including HTML views, PDF and ePub downloads, according to the available data) and Abstracts Views on Vision4Press platform.
Data correspond to usage on the plateform after 2015. The current usage metrics is available 48-96 hours after online publication and is updated daily on week days.
Initial download of the metrics may take a while.