Free Access
Fig. 15
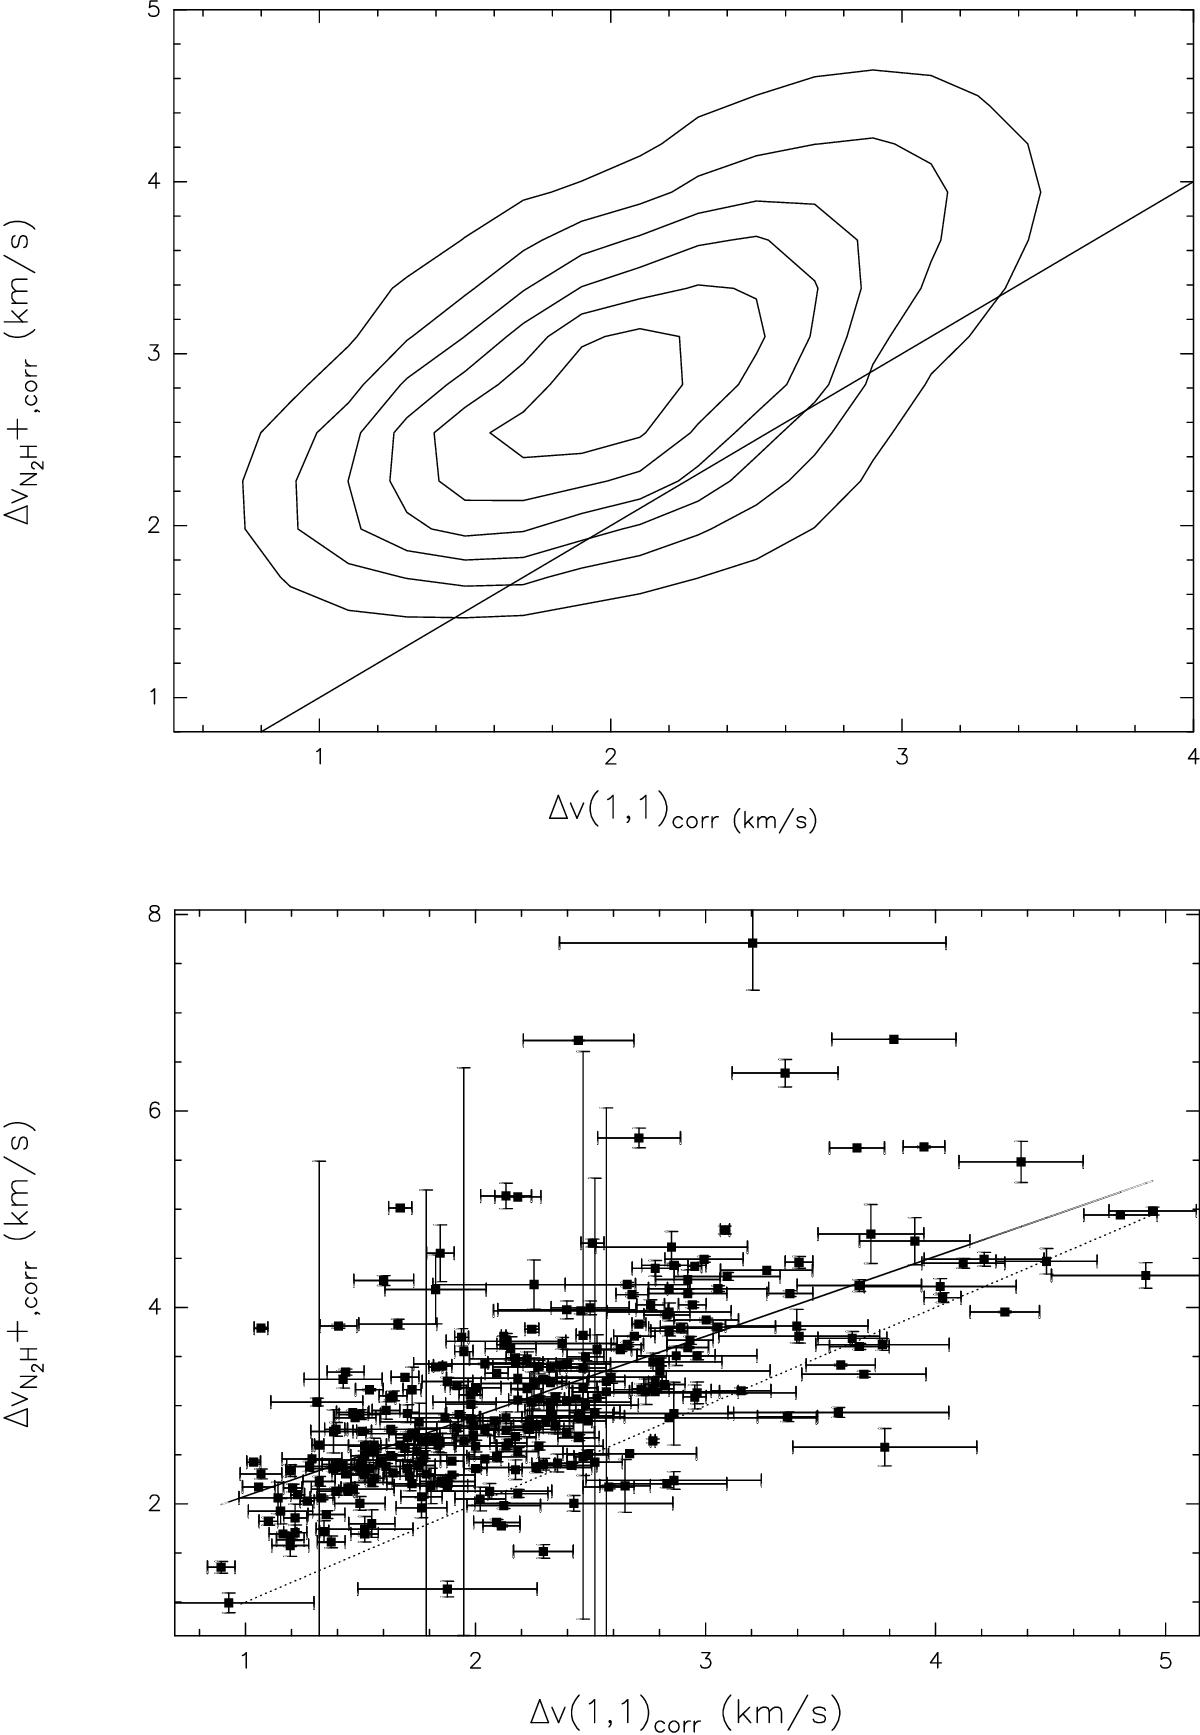
Dependence of N2H+ on NH3 line widths is shown as contour plot in the top panel and as a scatter plot in the lower panel. The binning of the two line widths in the contour plot is 0.5 km s-1. The dotted straight line indicates equality, the solid line denotes a fit to the data.
Current usage metrics show cumulative count of Article Views (full-text article views including HTML views, PDF and ePub downloads, according to the available data) and Abstracts Views on Vision4Press platform.
Data correspond to usage on the plateform after 2015. The current usage metrics is available 48-96 hours after online publication and is updated daily on week days.
Initial download of the metrics may take a while.