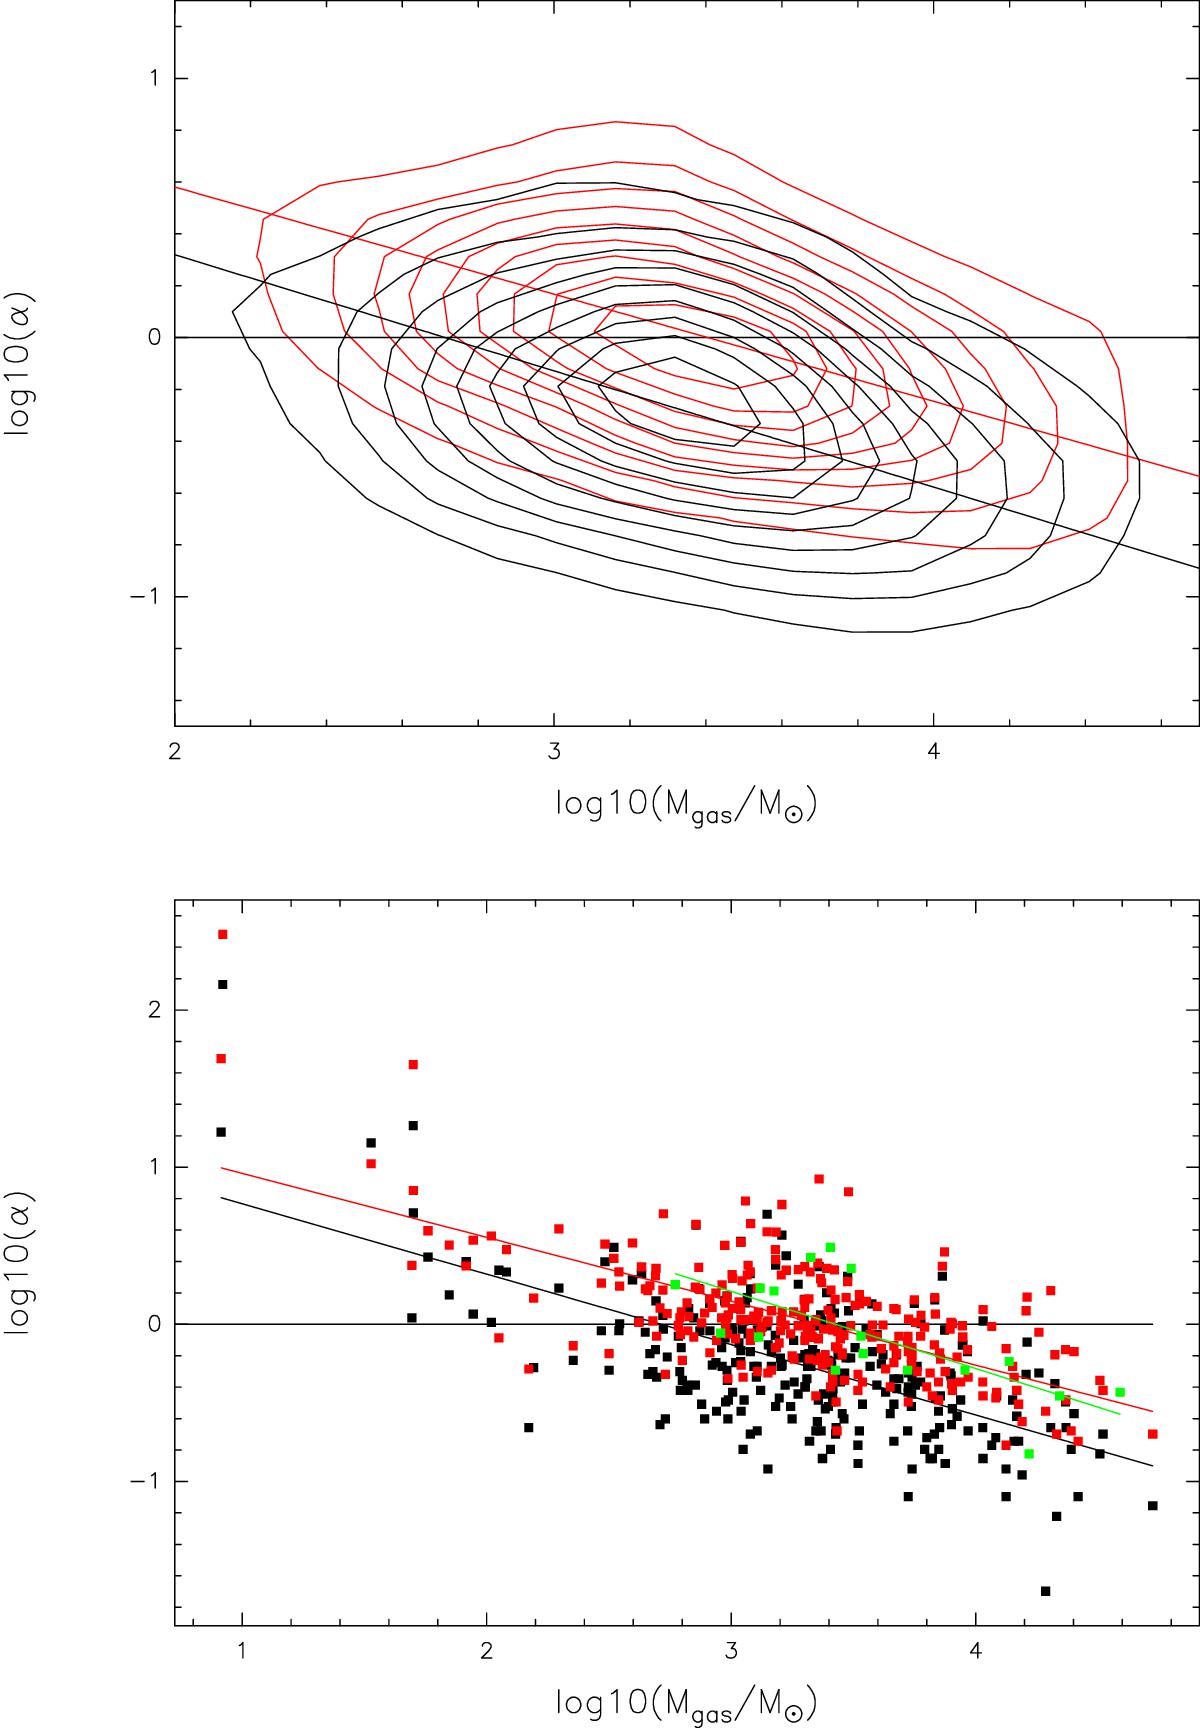
Fig. 18

Correlation plot of the logarithm of the virial parameter and the logarithm of the gas mass as black points for masses calculated using the NH3 line width, as red points using the N2H+ line width, and as green points for the C17O line width. The horizontal black line indicates a virial parameter of 1. A fit to each data set is shown as straight lines. The upper panel illustrates the contour plot, for which we counted the number of sources in each logarithmic gas mass and virial parameter bin of 0.3 in black for masses computed from the NH3 line width and in red for the N2H+ line width.
Current usage metrics show cumulative count of Article Views (full-text article views including HTML views, PDF and ePub downloads, according to the available data) and Abstracts Views on Vision4Press platform.
Data correspond to usage on the plateform after 2015. The current usage metrics is available 48-96 hours after online publication and is updated daily on week days.
Initial download of the metrics may take a while.


