Fig. 20
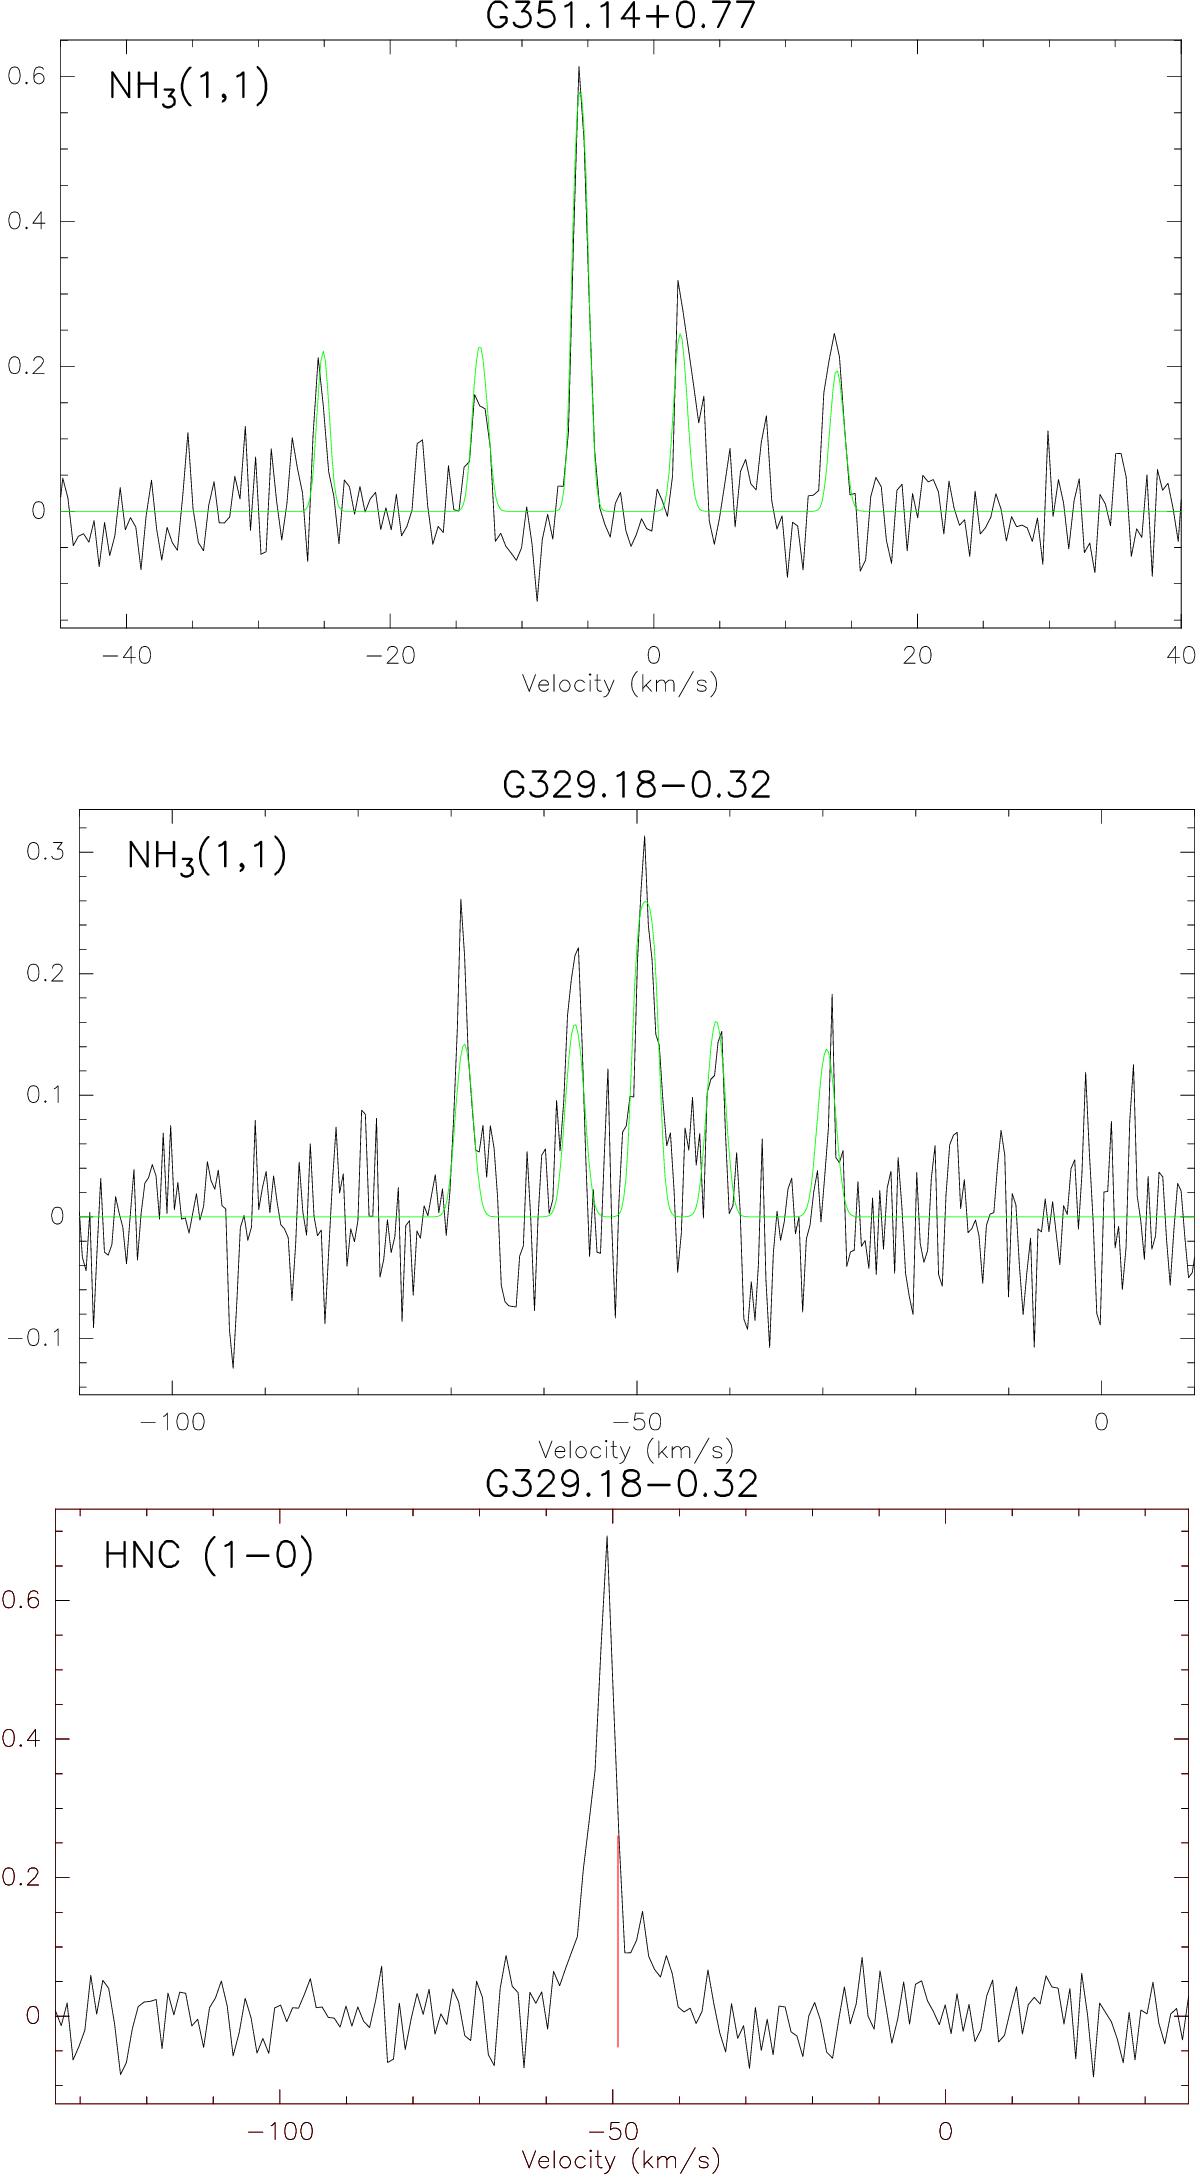
NH3 (1, 1) hyperfine anomaly of G351.14+0.77, which is illustrated in the upper panel, indicates a systematic outflow in this source. The middle panel displays the NH3 (1, 1) line profile of G329.18−0.32, which indicates an infall. This is also supported by its HNC (1–0) line in the lowest panel with a stronger blue- than redshifted peak. The source velocity is shown by the straight red line.
Current usage metrics show cumulative count of Article Views (full-text article views including HTML views, PDF and ePub downloads, according to the available data) and Abstracts Views on Vision4Press platform.
Data correspond to usage on the plateform after 2015. The current usage metrics is available 48-96 hours after online publication and is updated daily on week days.
Initial download of the metrics may take a while.