Fig. 5
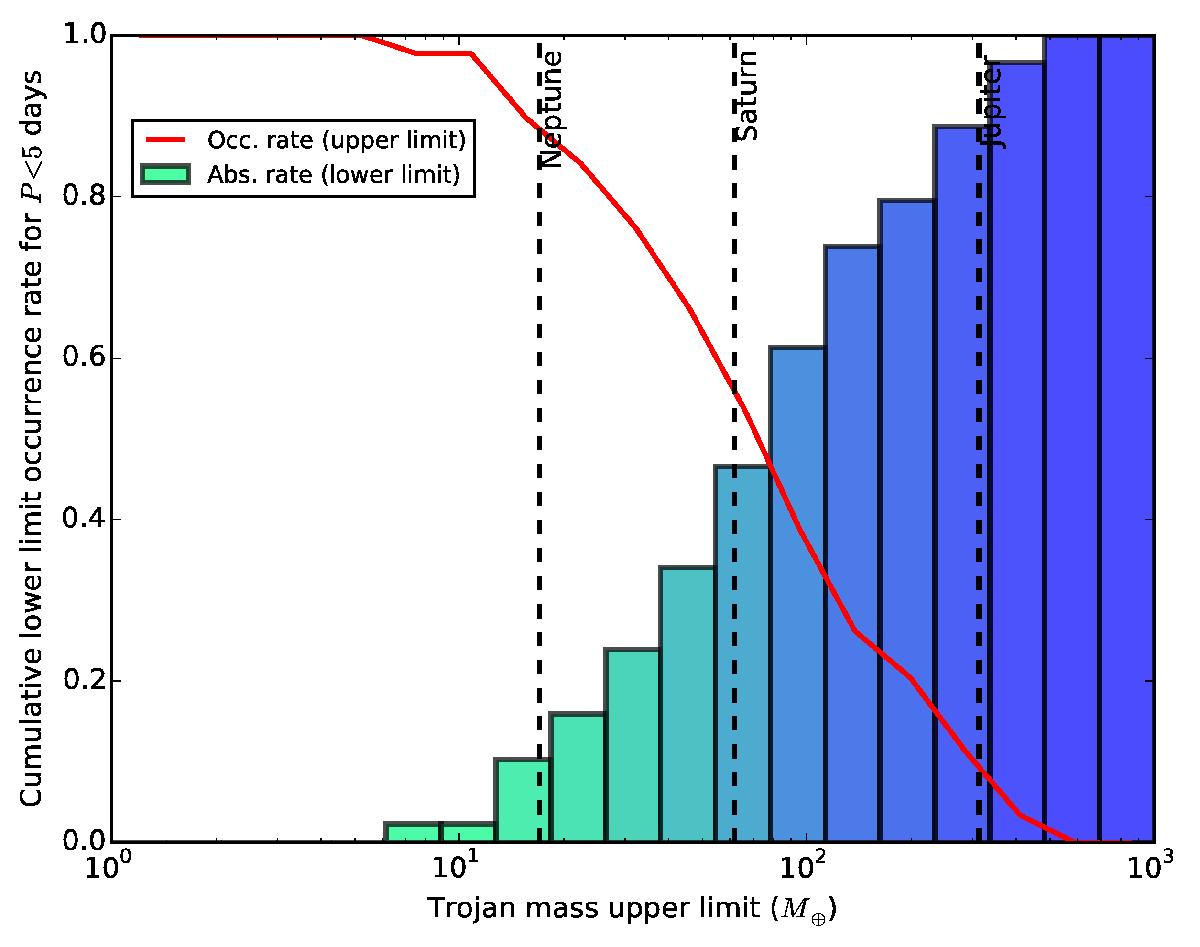
Estimation of the upper limits of the occurrence rate of trojans in the particular sample of planetary systems studied in this work. The upper mass limits were calculated as 95.4% confidence level on the α parameter and translated to mass values by assuming the trojan is located exactly at the Lagrangian points. The histogram shows the lower limit for the absence rate (color coded by the y-axis value), while the red line indicates the upper limit for the occurrence rate (inverted histogram, included for illustration purposes).
Current usage metrics show cumulative count of Article Views (full-text article views including HTML views, PDF and ePub downloads, according to the available data) and Abstracts Views on Vision4Press platform.
Data correspond to usage on the plateform after 2015. The current usage metrics is available 48-96 hours after online publication and is updated daily on week days.
Initial download of the metrics may take a while.