Fig. A.1
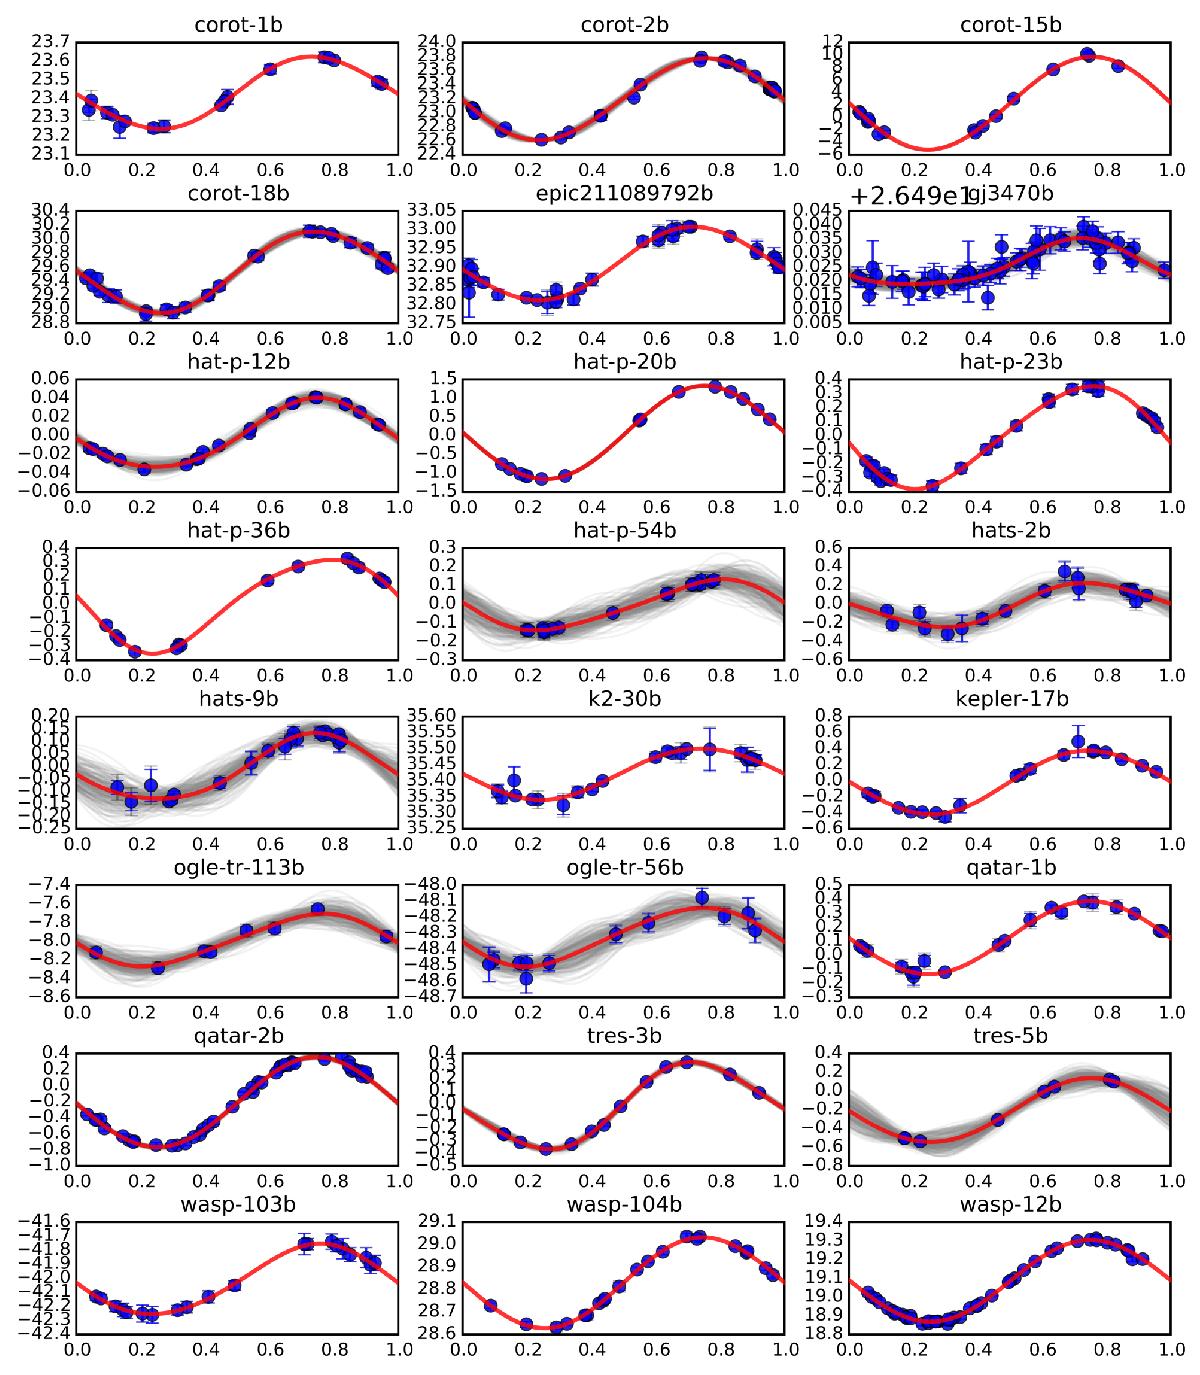
Phase-folded radial velocity curves (in km s-1) for the 46 systems studied (continuation in Fig. A.1). The blue circles represent the RV data (including errorbars). The red solid line shows the model corresponding to the median of the marginalized posterior distribution for each parameter. The gray lines show 100 models randomly chosen from the final MCMC chain.
Current usage metrics show cumulative count of Article Views (full-text article views including HTML views, PDF and ePub downloads, according to the available data) and Abstracts Views on Vision4Press platform.
Data correspond to usage on the plateform after 2015. The current usage metrics is available 48-96 hours after online publication and is updated daily on week days.
Initial download of the metrics may take a while.