Free Access
Fig. 5
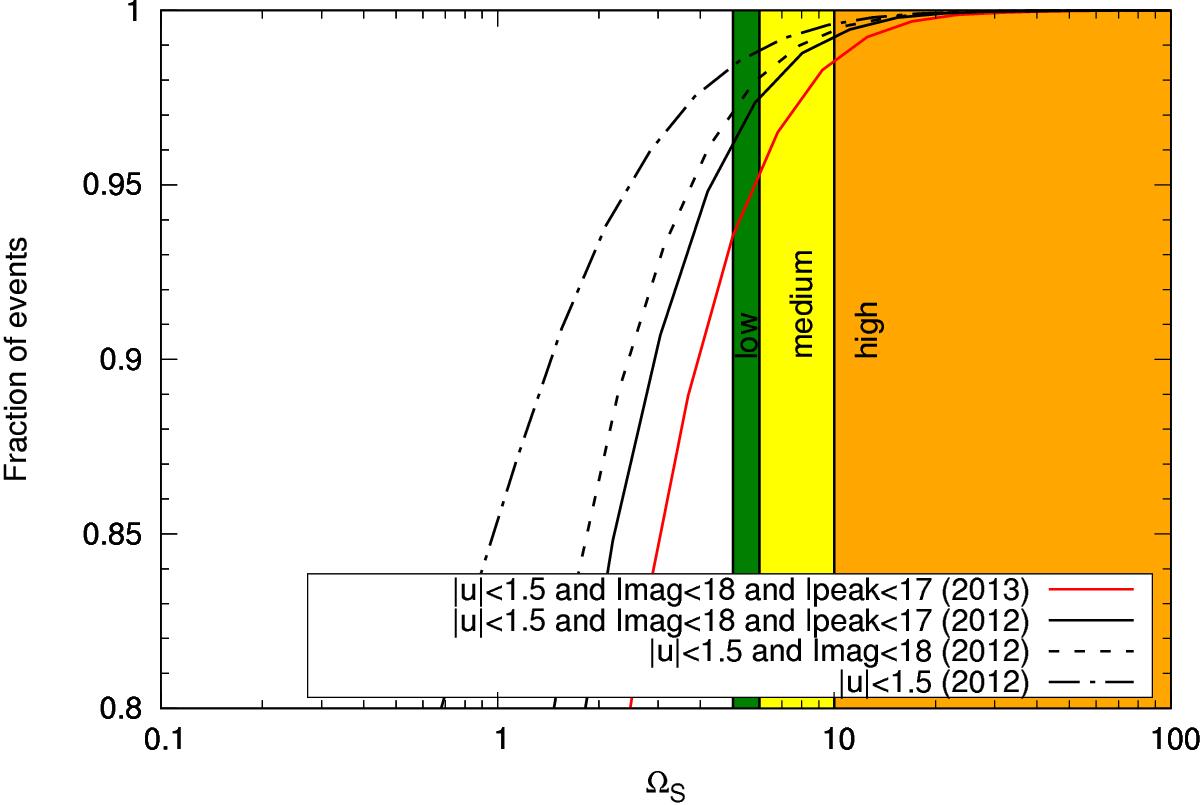
Cumulative priorities based on simulated events matching the season 2012 are shown for the underlying observing constraints and after the season 2013 has finished.
Current usage metrics show cumulative count of Article Views (full-text article views including HTML views, PDF and ePub downloads, according to the available data) and Abstracts Views on Vision4Press platform.
Data correspond to usage on the plateform after 2015. The current usage metrics is available 48-96 hours after online publication and is updated daily on week days.
Initial download of the metrics may take a while.