Fig. 9
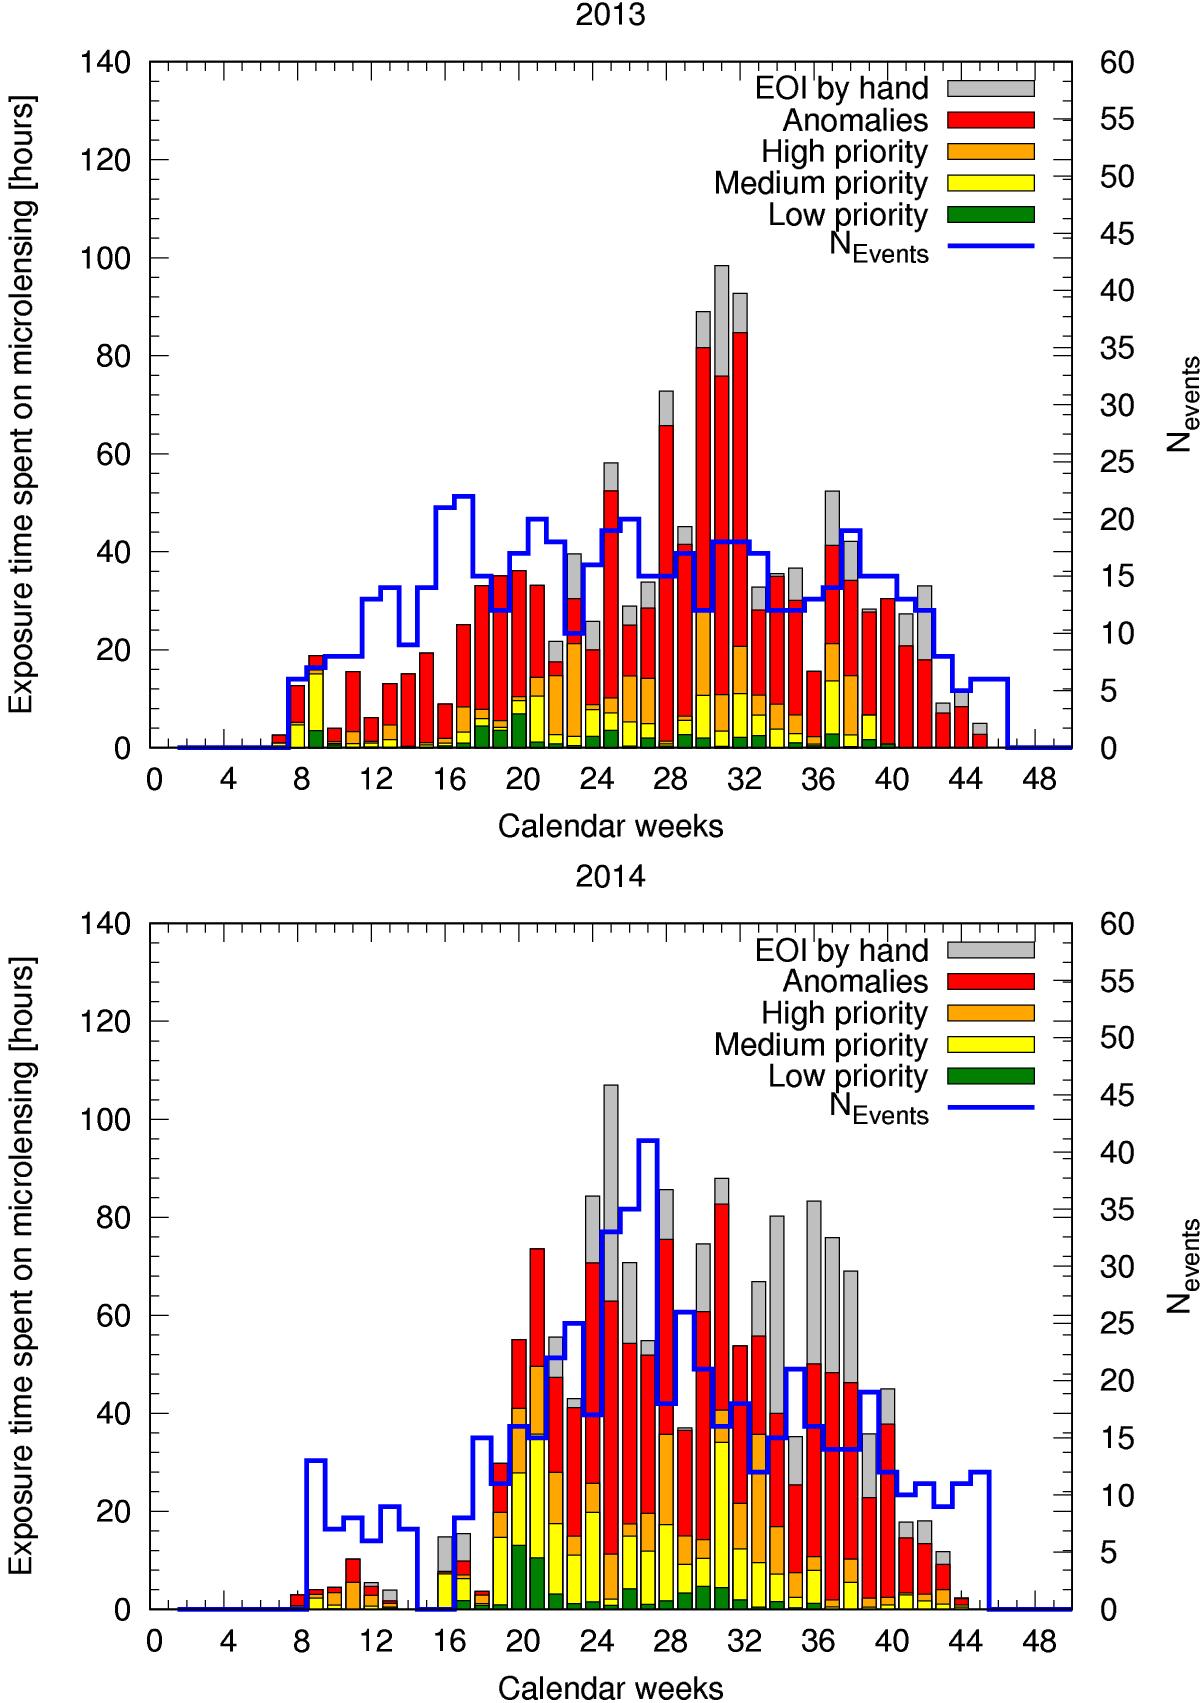
Weekly observations with the LCO 1 m network of microlensing events in each category including manually requested observations, which are denoted as events of interest (EOI), are shown for the 2013 and the 2014 season. The continuous blue curve provides the number of followed events. The LCO scheduler came online after calendar week 18 in 2014.
Current usage metrics show cumulative count of Article Views (full-text article views including HTML views, PDF and ePub downloads, according to the available data) and Abstracts Views on Vision4Press platform.
Data correspond to usage on the plateform after 2015. The current usage metrics is available 48-96 hours after online publication and is updated daily on week days.
Initial download of the metrics may take a while.