Fig. 1
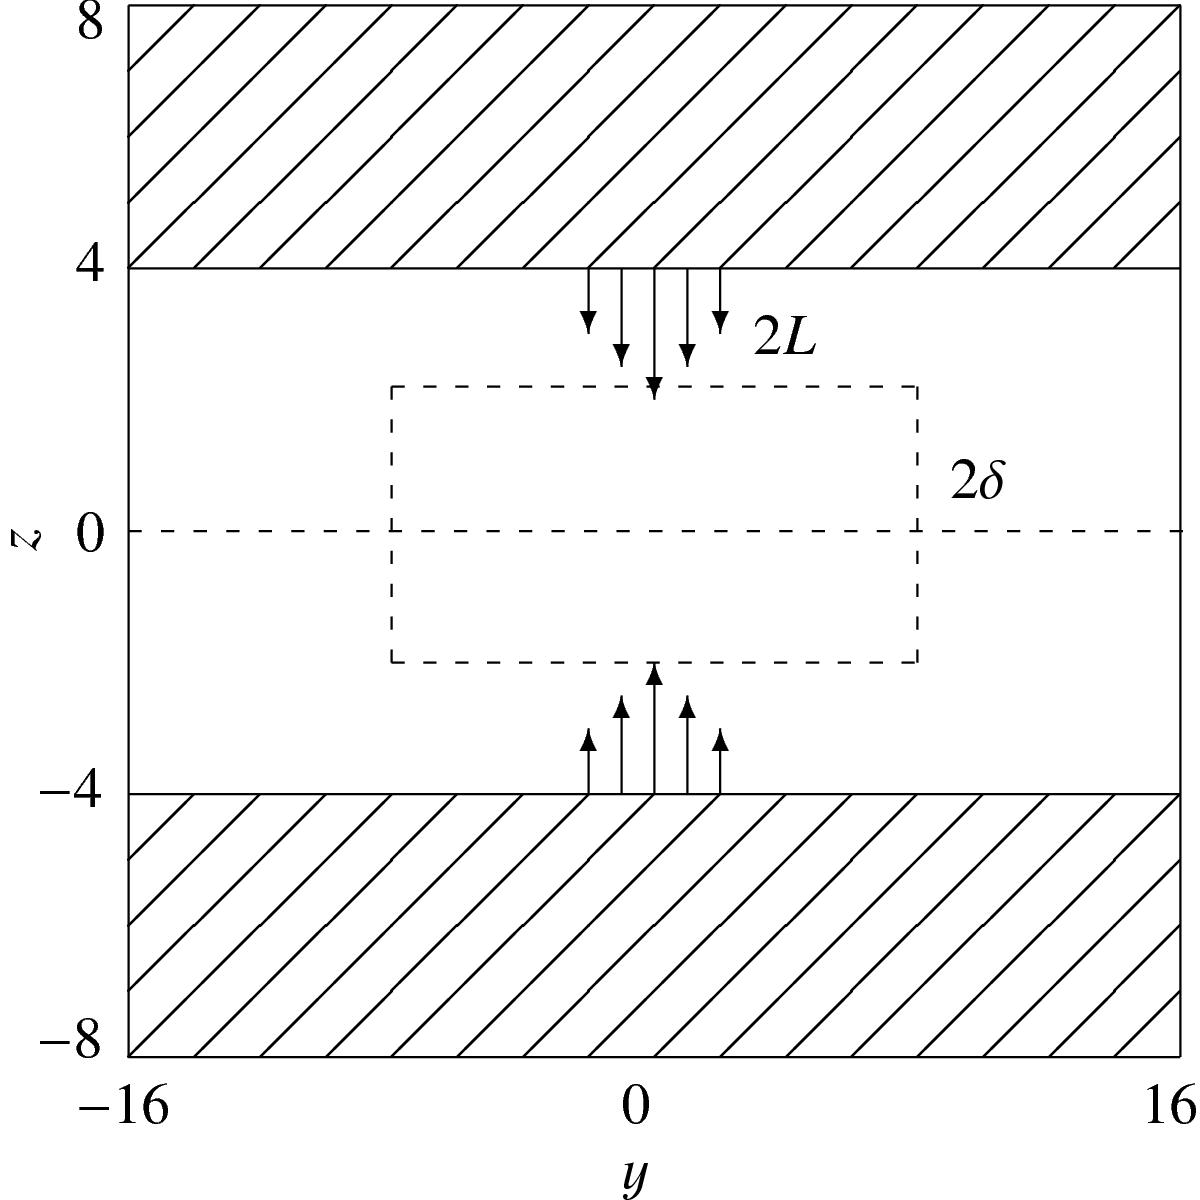
Computational domain. y ranges between ± 16, z ranges between ± 8. The drivers are defined for | z | ≥ 4, denoted by the arrows. Shaded region indicates the damping zone. A reconnection region of width 2δ and height 2L is fitted to the domain. The line z = 0 is the location of the Harris current sheet. y and z are normalised by 104 km.
Current usage metrics show cumulative count of Article Views (full-text article views including HTML views, PDF and ePub downloads, according to the available data) and Abstracts Views on Vision4Press platform.
Data correspond to usage on the plateform after 2015. The current usage metrics is available 48-96 hours after online publication and is updated daily on week days.
Initial download of the metrics may take a while.