Fig. 4
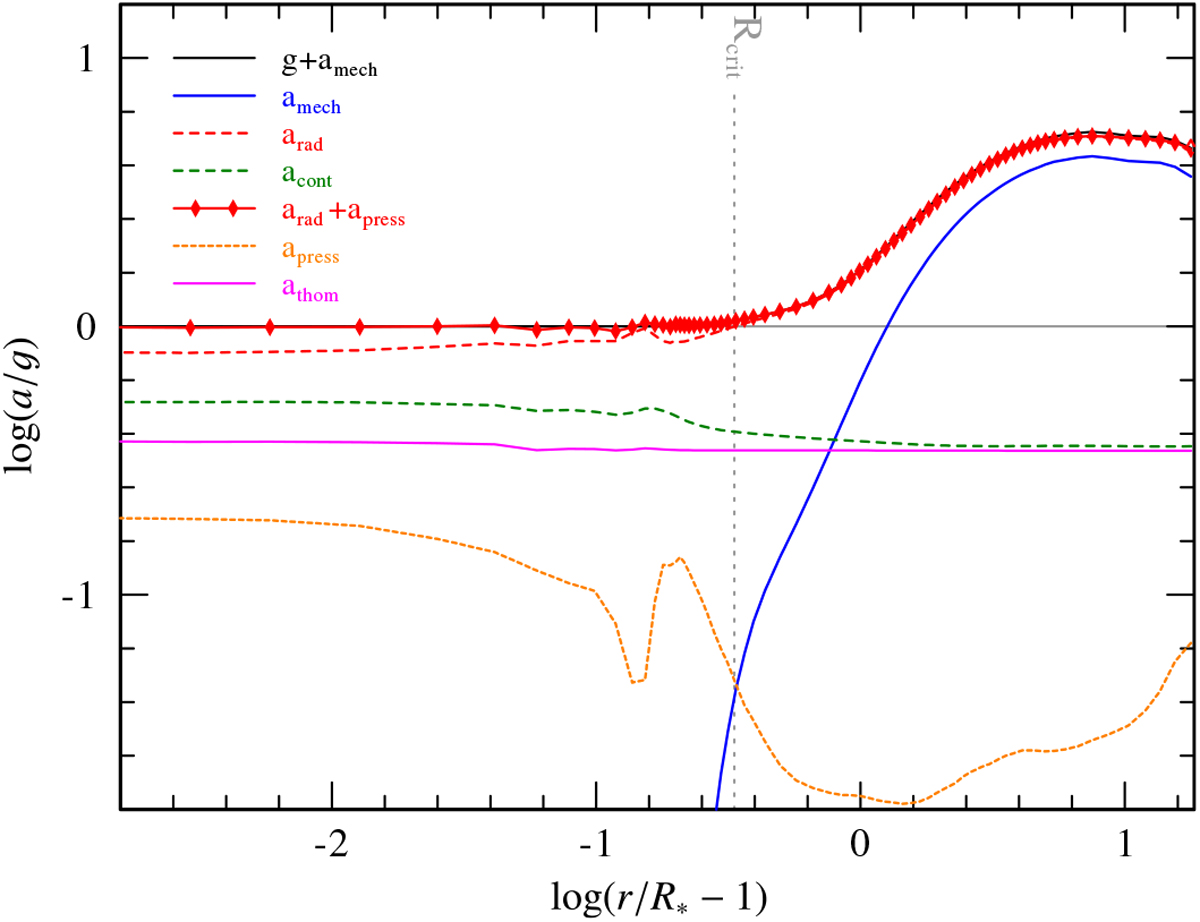
Detailed acceleration stratification for the HD consistent model using the moderate X-ray flux. The wind acceleration (thick red diamond line) is compared to the repulsive sum of inertia and gravitational acceleration g(r) (black line). The input parameters of the model are given in Table 3, while the resulting quantities are listed in Table 2. In order to properly handle the various scales, this is a double-logarithmic plot with all acceleration terms normalized to g(r).
Current usage metrics show cumulative count of Article Views (full-text article views including HTML views, PDF and ePub downloads, according to the available data) and Abstracts Views on Vision4Press platform.
Data correspond to usage on the plateform after 2015. The current usage metrics is available 48-96 hours after online publication and is updated daily on week days.
Initial download of the metrics may take a while.