Fig. 1
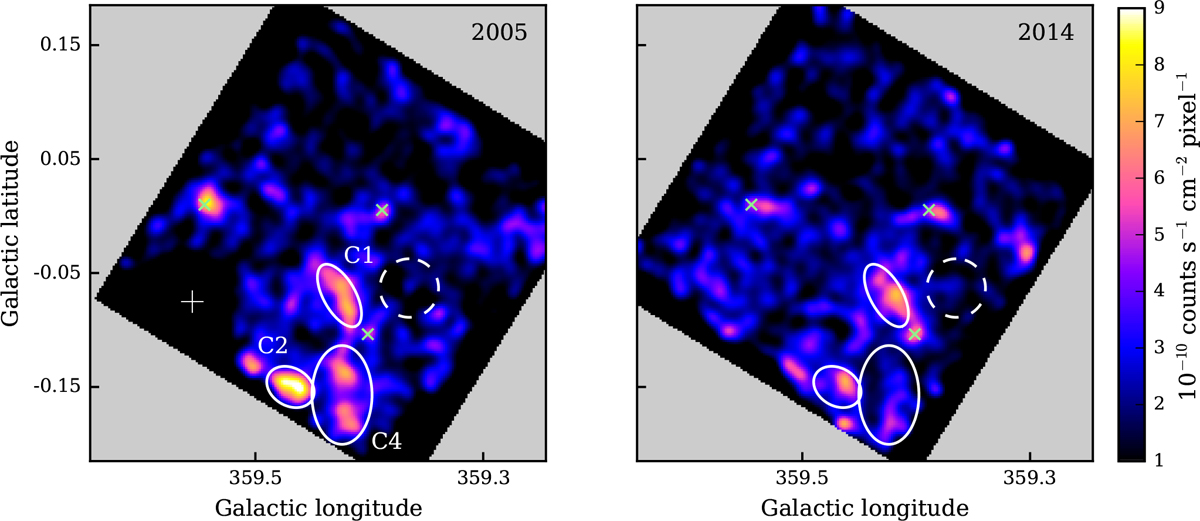
Chandra continuum-subtracted images of the Fe Kα emission in Sgr Cfor the observations taken in 2005 (left) and 2014 (right). The maps are in units of counts s−1 cm−2 pixel−1 with a pixel size of about 1″, and smoothed using a Gaussian kernel of 20-pixel radius. The regions of interest (Sgr C1, Sgr C2, and Sgr C4) are marked by the solid ellipses (see Table 2). The dashed circle shows the control region. The white cross marks the position of the X-ray transient KS 1741−293, which has been removed from the 2005 dataset. The green crosses mark the positions of bright point sources (F0.5−8 keV > 10−5 counts s−1 cm−2) from the catalogue of Muno et al. (2006) that remain visible in the 6.4 keV band after continuum subtraction.
Current usage metrics show cumulative count of Article Views (full-text article views including HTML views, PDF and ePub downloads, according to the available data) and Abstracts Views on Vision4Press platform.
Data correspond to usage on the plateform after 2015. The current usage metrics is available 48-96 hours after online publication and is updated daily on week days.
Initial download of the metrics may take a while.