Fig. 4
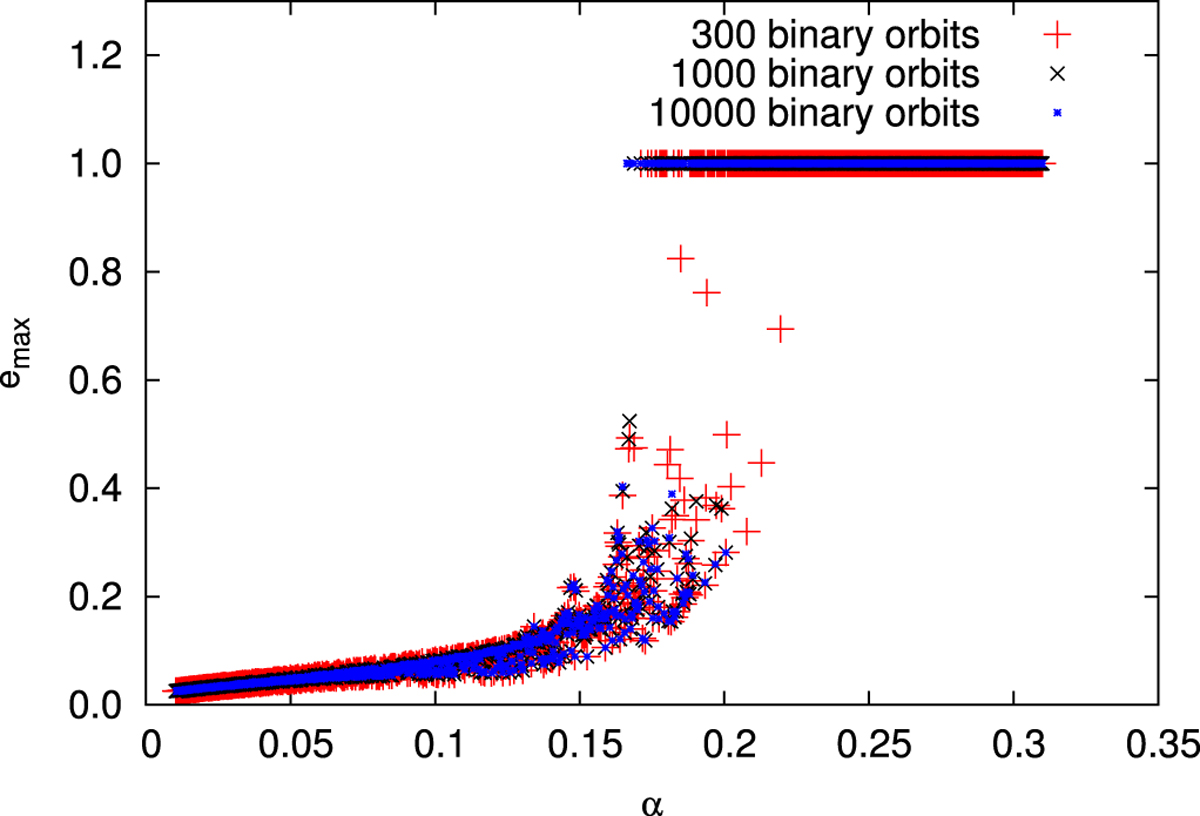
Value of α against emax for three different binary periods for the same mass and binary eccentricity. In this case ip = 0° and the parameters of the secondary are e2 = 0.6 and m2 = 0.66. It can be seen that the difference between the critical semimajor axis when the particles become unstable is not significantly different between 300 (red plot), 1000 (black plot) and 10 000 binary periods (blue plot).
Current usage metrics show cumulative count of Article Views (full-text article views including HTML views, PDF and ePub downloads, according to the available data) and Abstracts Views on Vision4Press platform.
Data correspond to usage on the plateform after 2015. The current usage metrics is available 48-96 hours after online publication and is updated daily on week days.
Initial download of the metrics may take a while.