Fig. 2
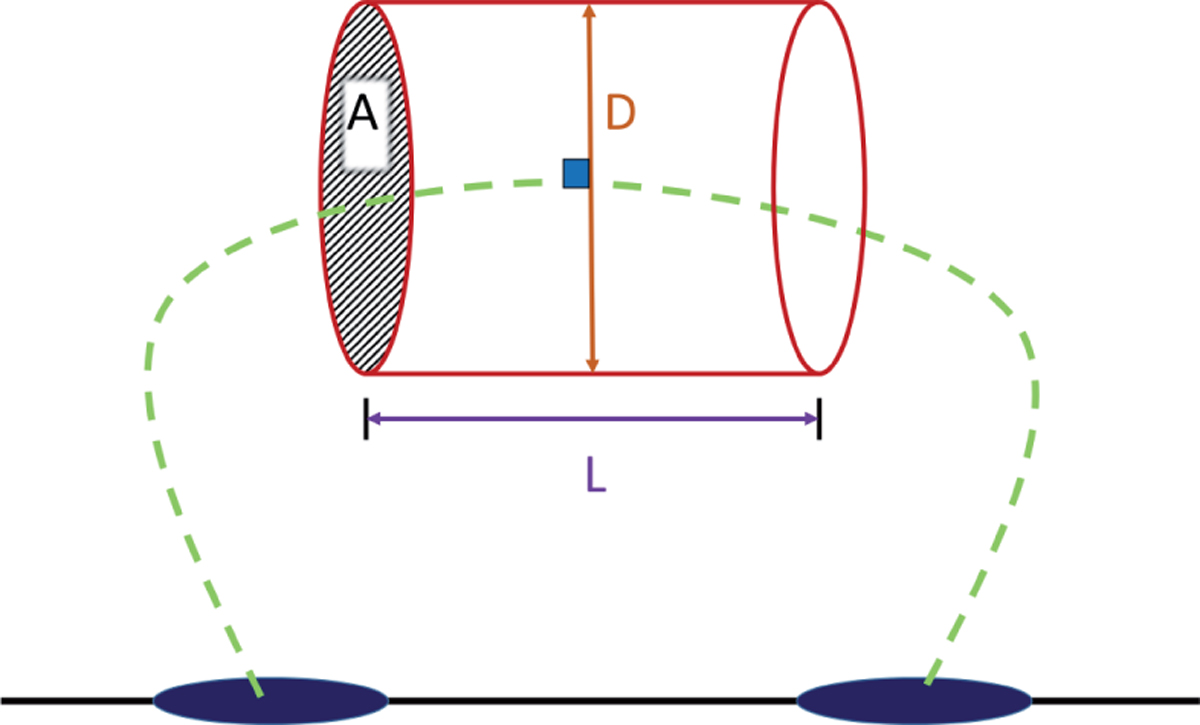
Sketch of the geometry showing parameters used to calculate V th, ne, and L. The chromosphere is shown by the black solid line, with the HXR footpoints shown in blue. The loop midline is shown by the green dashed line. The diameter, D, is shown by the orange line. The length, L, is shown by the purple line and the cross-sectional area, A, is shown by the shaded end.
Current usage metrics show cumulative count of Article Views (full-text article views including HTML views, PDF and ePub downloads, according to the available data) and Abstracts Views on Vision4Press platform.
Data correspond to usage on the plateform after 2015. The current usage metrics is available 48-96 hours after online publication and is updated daily on week days.
Initial download of the metrics may take a while.