Fig. 3
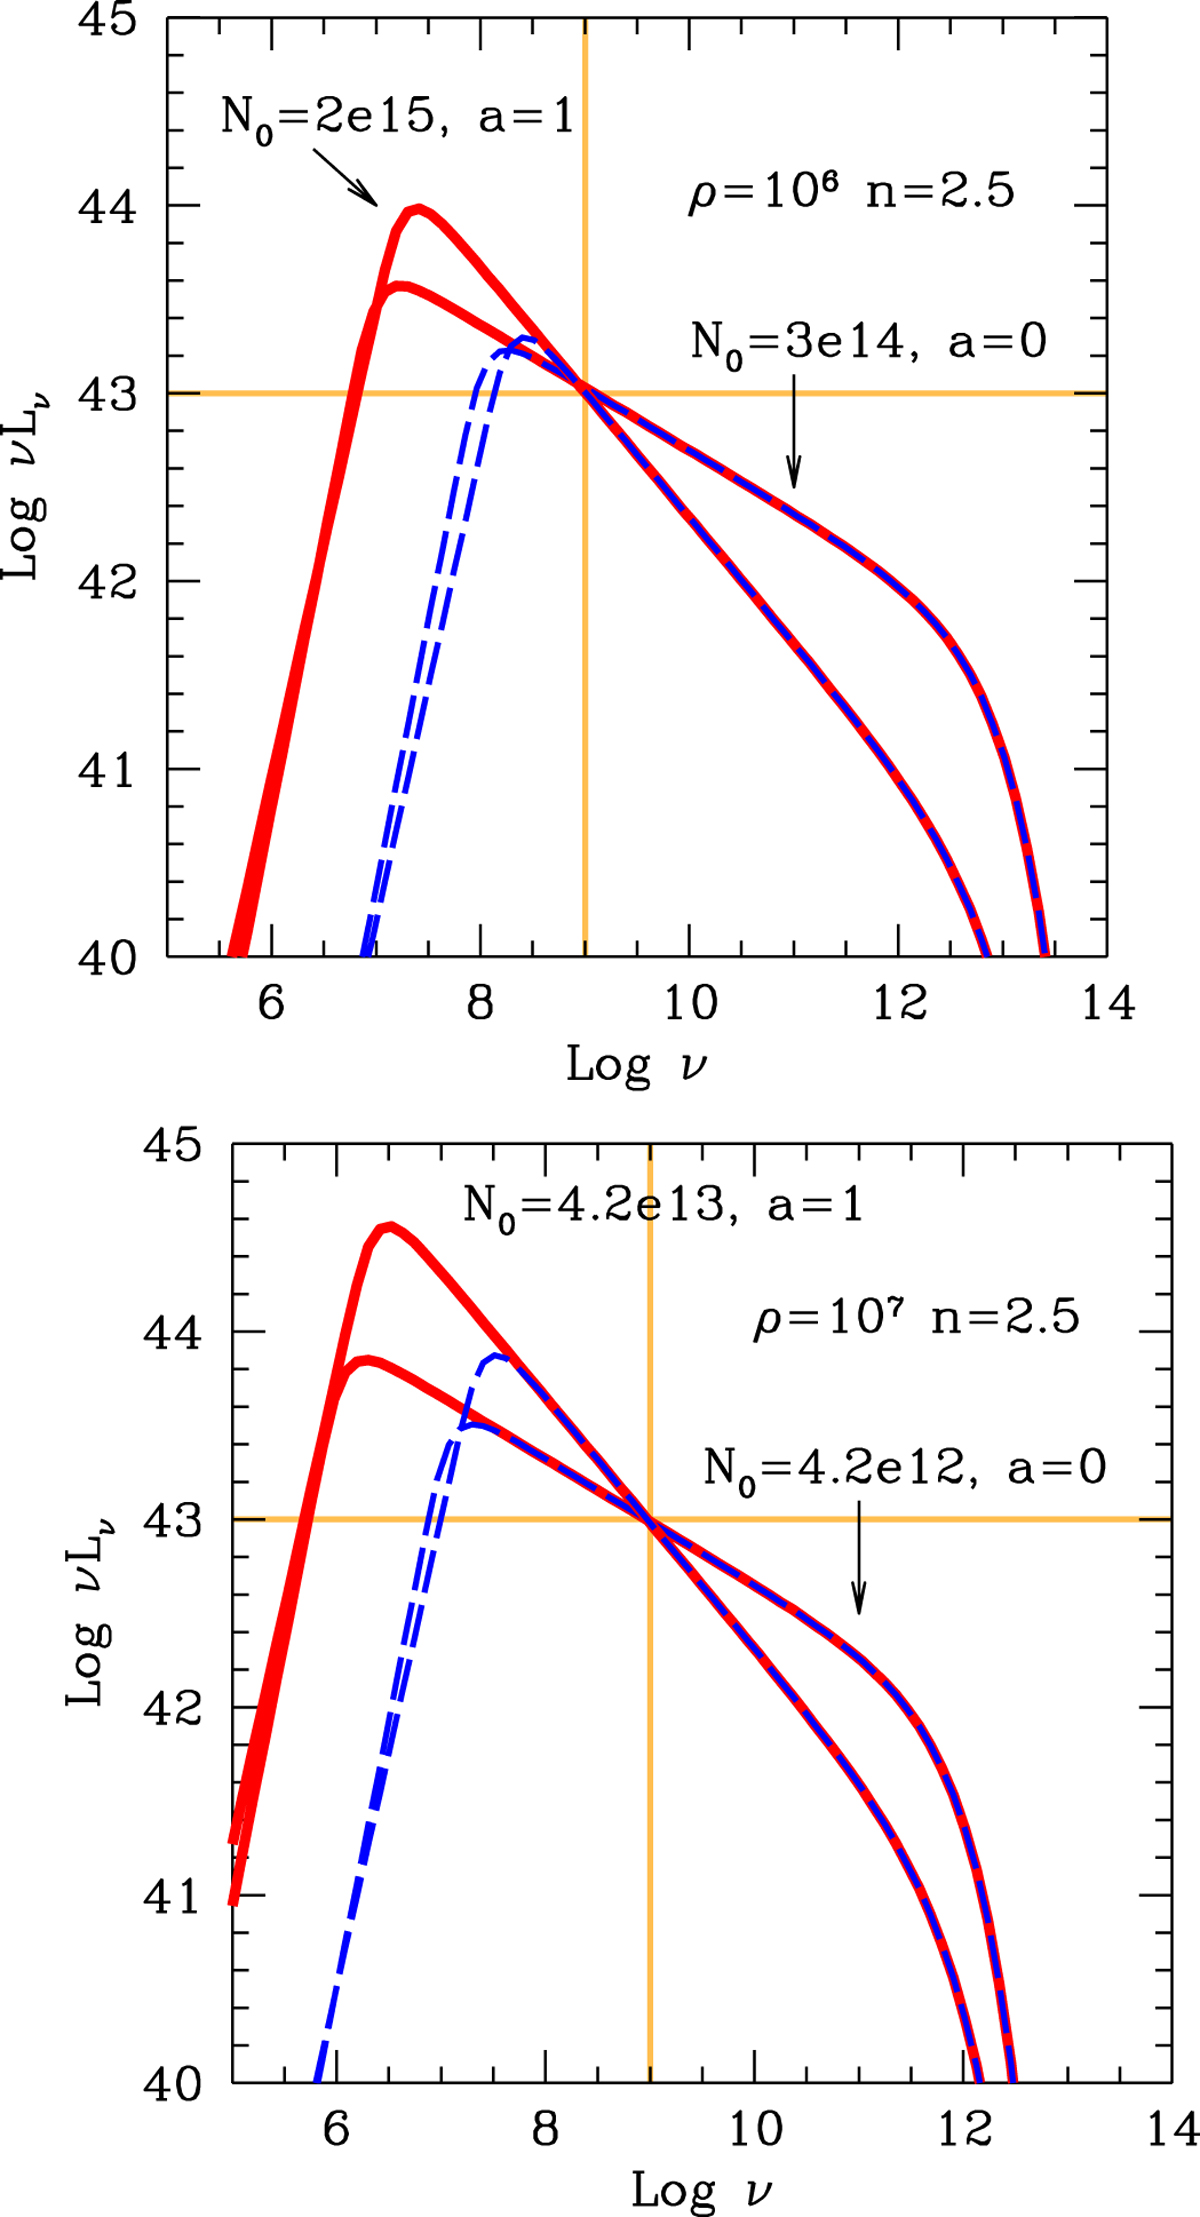
Spectra, in the ν–νLν representation, produced by a power law distribution of particles accounting for a luminosity of 1043 erg s−1 at 1 GHz. The adopted slope is n = 2.5. The solid lines show spectra produced by protons; the dashed lines represent the spectra produced by leptons. The different slopes are due to the different a value, controlling the amount of collimation of the radiation, and not to a differentslope of the electron distribution. The top panel gives examples for ρ = 106 cm. The bottom panel shows examples for ρ = 107 cm. Parameters, listed in Table 1, were found to minimize the required total energy. N0 indicated in units of cm−3 and ρ in cm.
Current usage metrics show cumulative count of Article Views (full-text article views including HTML views, PDF and ePub downloads, according to the available data) and Abstracts Views on Vision4Press platform.
Data correspond to usage on the plateform after 2015. The current usage metrics is available 48-96 hours after online publication and is updated daily on week days.
Initial download of the metrics may take a while.