Fig. 2
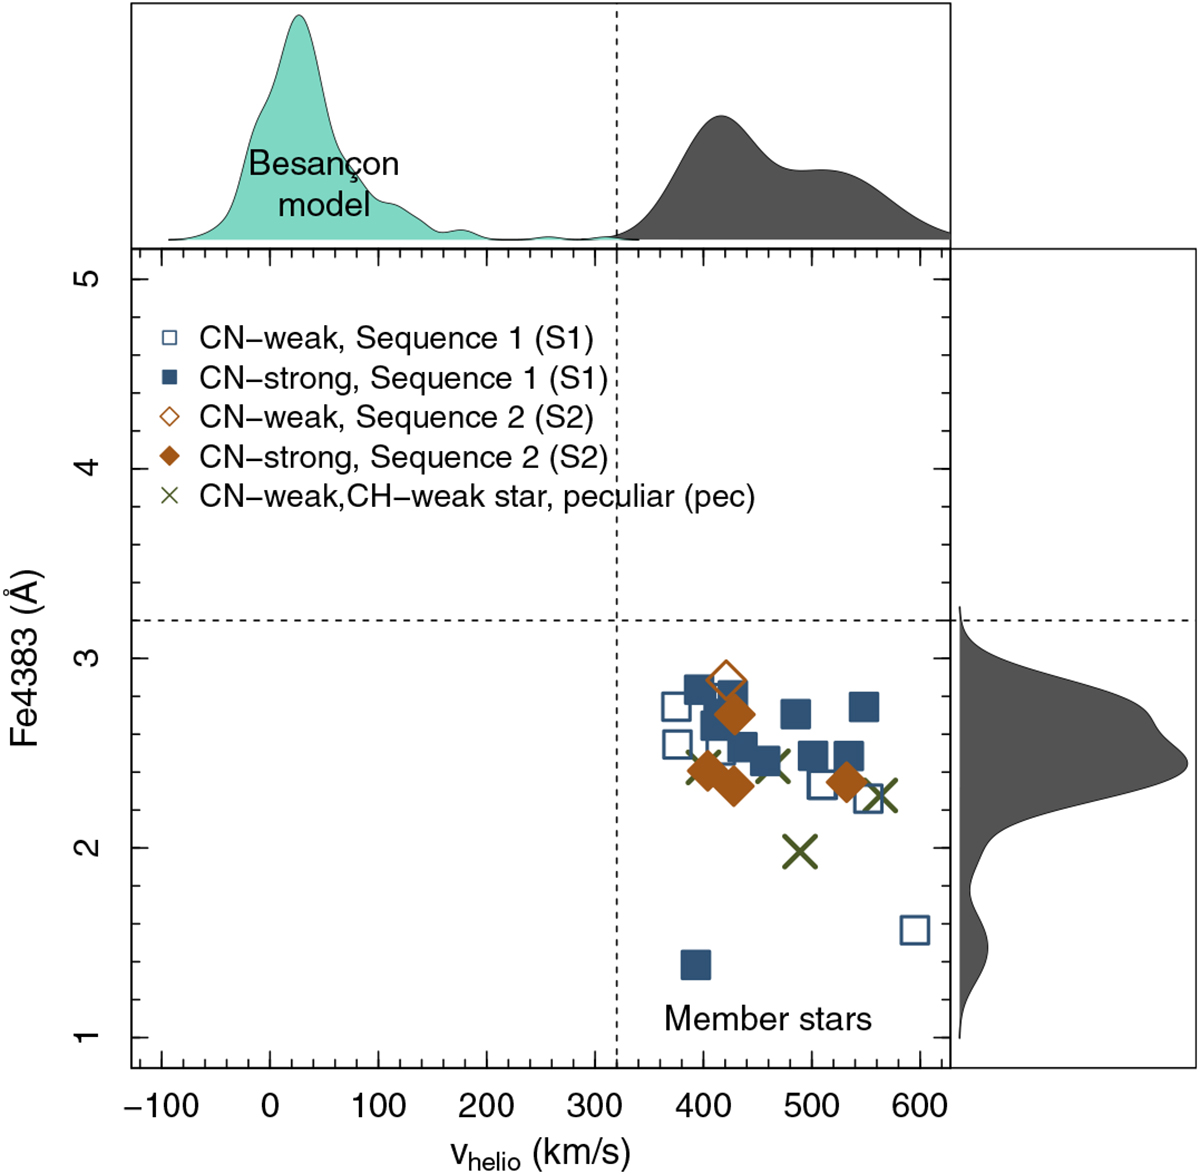
Heliocentric velocities versus Fe4383 index for all 28 valid spectra. Smoothed histograms show the distribution of the two parameters. We also show the velocities distribution from the Besançon model. Member stars are located in the lower right quadrant indicated by the dashed lines. Sequence 1 (S1), sequence 2 (S2), and peculiar stars (pec.) defined in Fig. 5 are indicated by blue squares, orange diamonds, and green crosses, respectively. CN-strong (δS(3839) ≥ 0) and CN-weak stars (δS(3839) < 0) are represented by filled and open symbols, respectively. These symbols and colours are used also in the following figures. Dashed lines are set by eye at the lower limit of vhelio and the upper limit of Fe4383 distributions.
Current usage metrics show cumulative count of Article Views (full-text article views including HTML views, PDF and ePub downloads, according to the available data) and Abstracts Views on Vision4Press platform.
Data correspond to usage on the plateform after 2015. The current usage metrics is available 48-96 hours after online publication and is updated daily on week days.
Initial download of the metrics may take a while.