Fig. 7
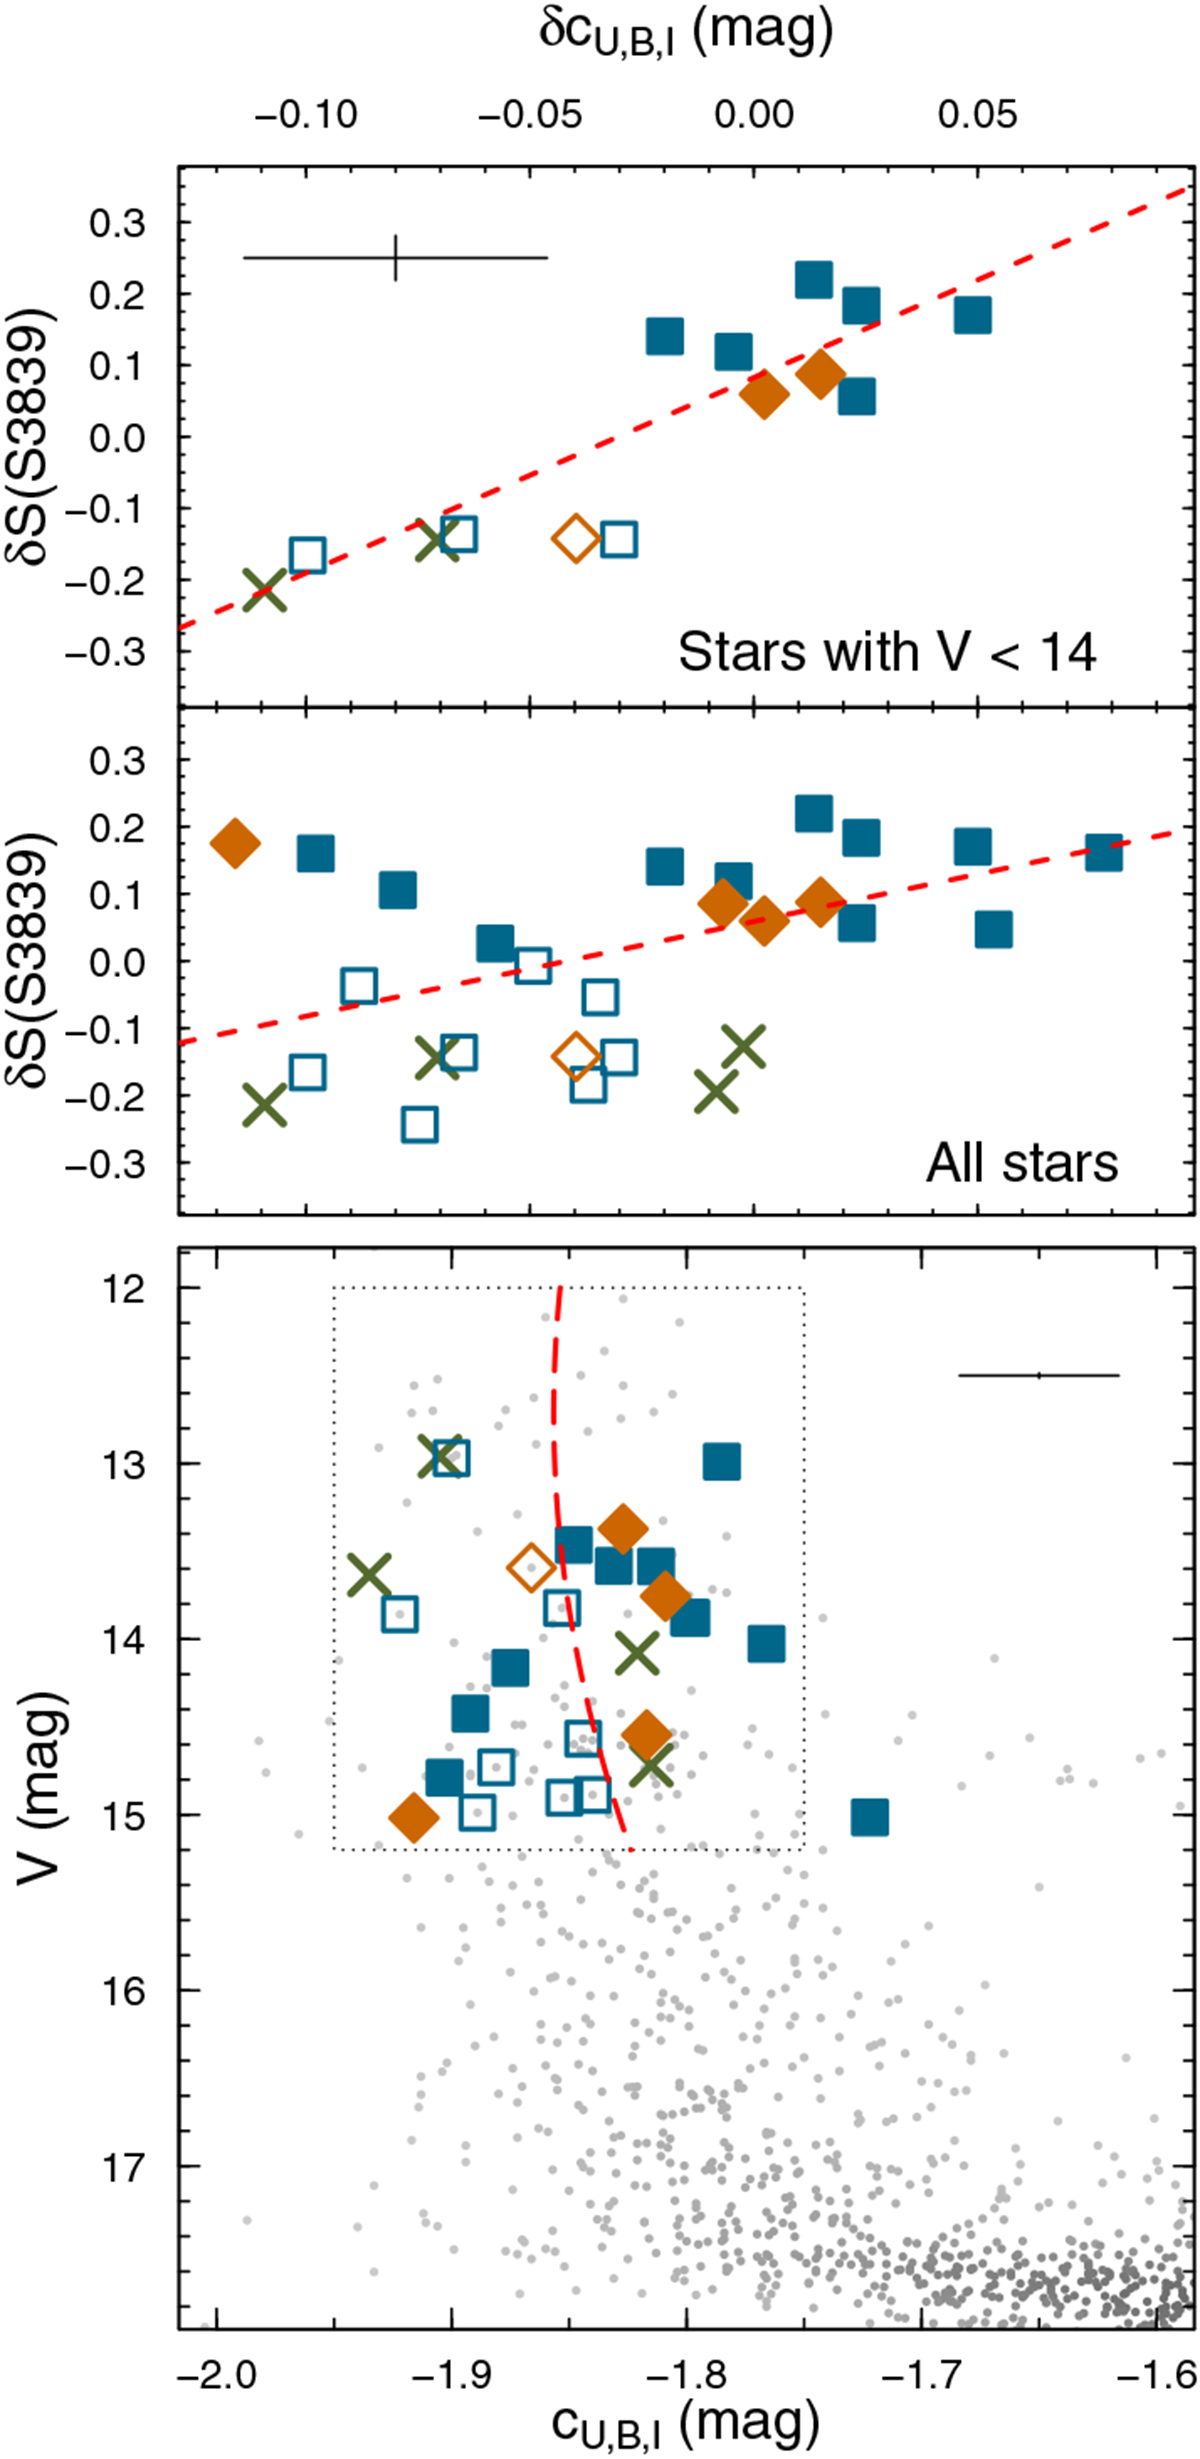
Bottom panel: V −cU,B,I diagram for NGC 3201 using photometry from Kravtsov et al. (2009) corrected by differential reddening but without decontamination from field stars. We selected a rectangle around the RGB stars and fitted a second-order polynomial shown by a dashed red line. This line is used to define δcU,B,I as the difference between cU,B,I and the fitted line for a given V magnitudefor the 28 stars analysed here. Symbols are the same as in Fig. 2. Average error bars are indicated at the upper right corner. Middle panel: correlation between δS(3839) and δcU,B,I for all 28 stars. A linear fit to the S1 stars is shown by a red dashed line. Upper panel: same as middle panel but only for the 14 stars brighter than V < 14 mag. Average error bars are indicated at the upper left corner.
Current usage metrics show cumulative count of Article Views (full-text article views including HTML views, PDF and ePub downloads, according to the available data) and Abstracts Views on Vision4Press platform.
Data correspond to usage on the plateform after 2015. The current usage metrics is available 48-96 hours after online publication and is updated daily on week days.
Initial download of the metrics may take a while.