Fig. B.1
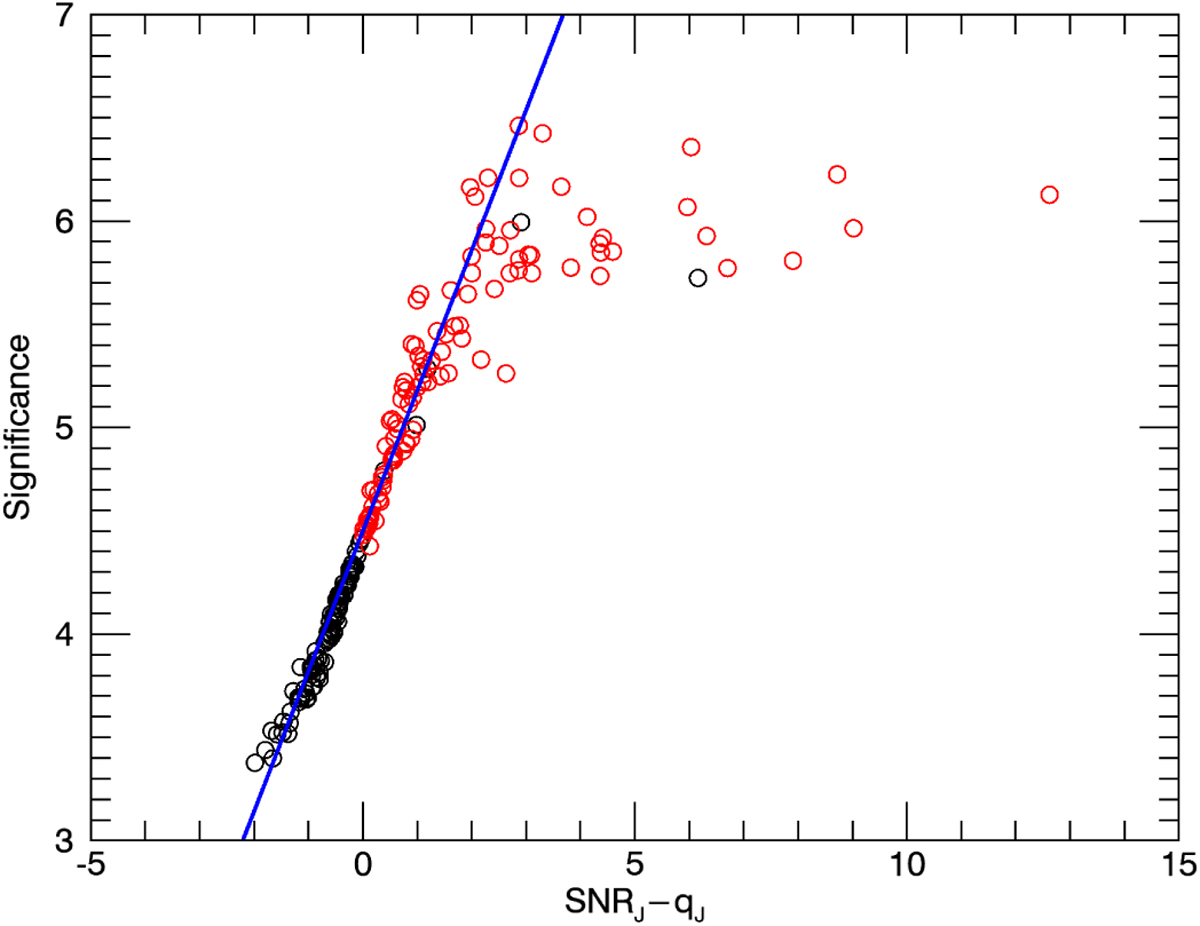
Significance as a function of (S/N)J − qJ for the second phase detections corresponding to PFA = 3.40 × 10⁻⁶, with (S/N)sz > 3 and outside the SZ mask. Red circles indicate the detections that pass all the other cuts (texp > 100 s and (S/N)J > qJ), while black circles indicate the detections that do not pass them. The solid blue line is the best linear fit with a fixed intercept of 4.5.
Current usage metrics show cumulative count of Article Views (full-text article views including HTML views, PDF and ePub downloads, according to the available data) and Abstracts Views on Vision4Press platform.
Data correspond to usage on the plateform after 2015. The current usage metrics is available 48-96 hours after online publication and is updated daily on week days.
Initial download of the metrics may take a while.