Fig. 19
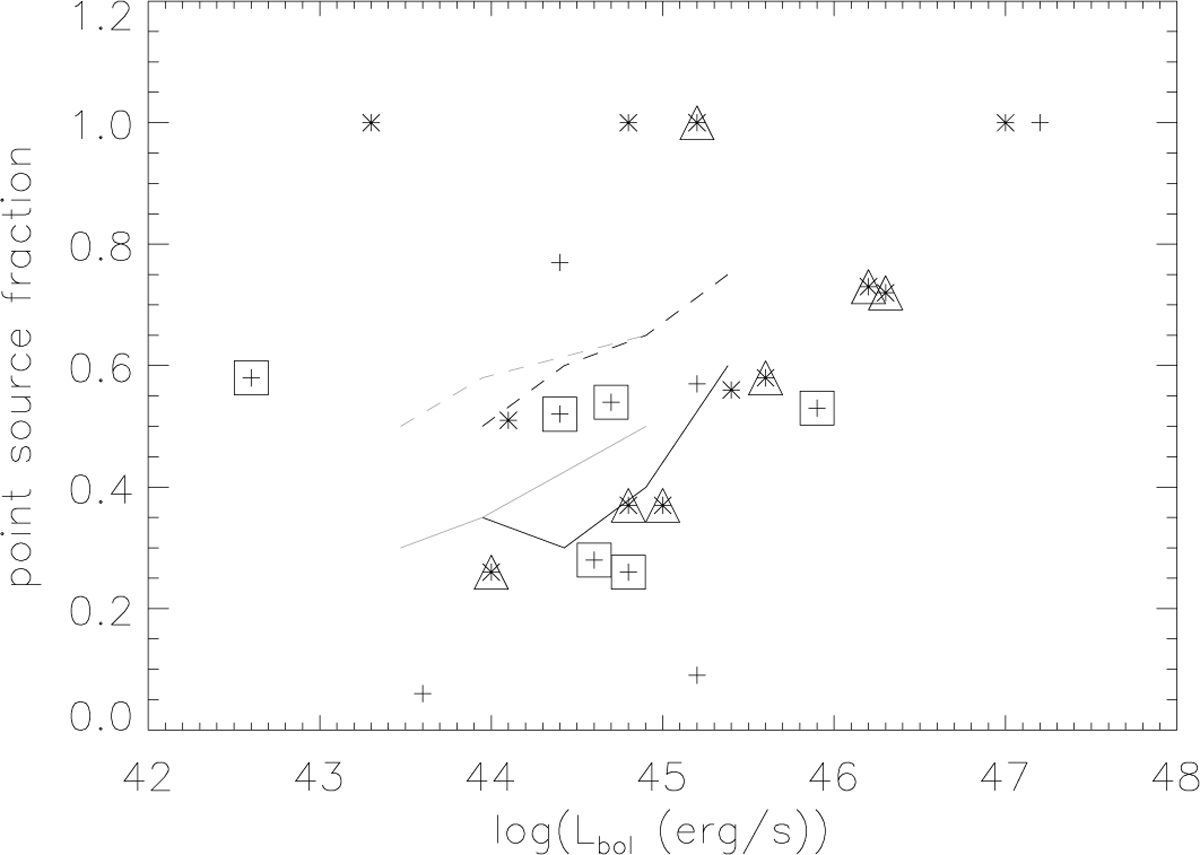
Observed point source fraction as a function of the bolometric luminosity. Pluses show type 2 objects. Stars show type 1 objects. Triangles show type 1 objects with point source fluxes within (6 ± 1) × rsub. Squares show type 2 objects with point source fluxes within (6 ± 1) × rsub. The dark solid line is the NGC 1068 model with r = 6 × rsub. The gray solid line is the NGC 1068 model with r = 9 × rsub. The dark dashed line is the Circinus model with r = 6 × rsub. The gray dashed line is the Circinus model with r = 9 × rsub.
Current usage metrics show cumulative count of Article Views (full-text article views including HTML views, PDF and ePub downloads, according to the available data) and Abstracts Views on Vision4Press platform.
Data correspond to usage on the plateform after 2015. The current usage metrics is available 48-96 hours after online publication and is updated daily on week days.
Initial download of the metrics may take a while.