Fig. 6
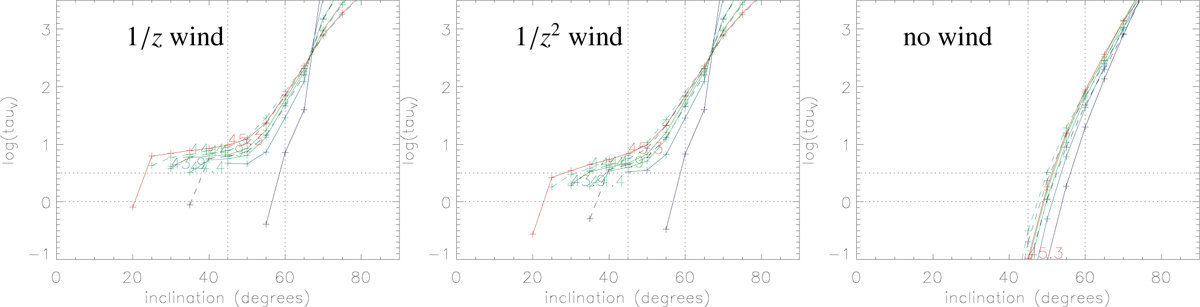
Optical depth τV as a functionof the inclination angle of the gas disk. The colors correspond to different bolometric luminosities. Left panel: wind with 1∕z density profile. Middle panel: wind with 1∕z2 density profile. Right panel: no wind component. The numbers indicate the logarithm of the bolometric luminosities of the models in erg s−1. The horizontal dotted lines correspond to τV = 1 and 3, i.e., the transition from type 1 to type 2 objects. The vertical dotted lines correspond to the range of inclination angles where the degree of polarized optical emission changes from type 1 to type 2 objects (Marin 2014).
Current usage metrics show cumulative count of Article Views (full-text article views including HTML views, PDF and ePub downloads, according to the available data) and Abstracts Views on Vision4Press platform.
Data correspond to usage on the plateform after 2015. The current usage metrics is available 48-96 hours after online publication and is updated daily on week days.
Initial download of the metrics may take a while.