Fig. 1
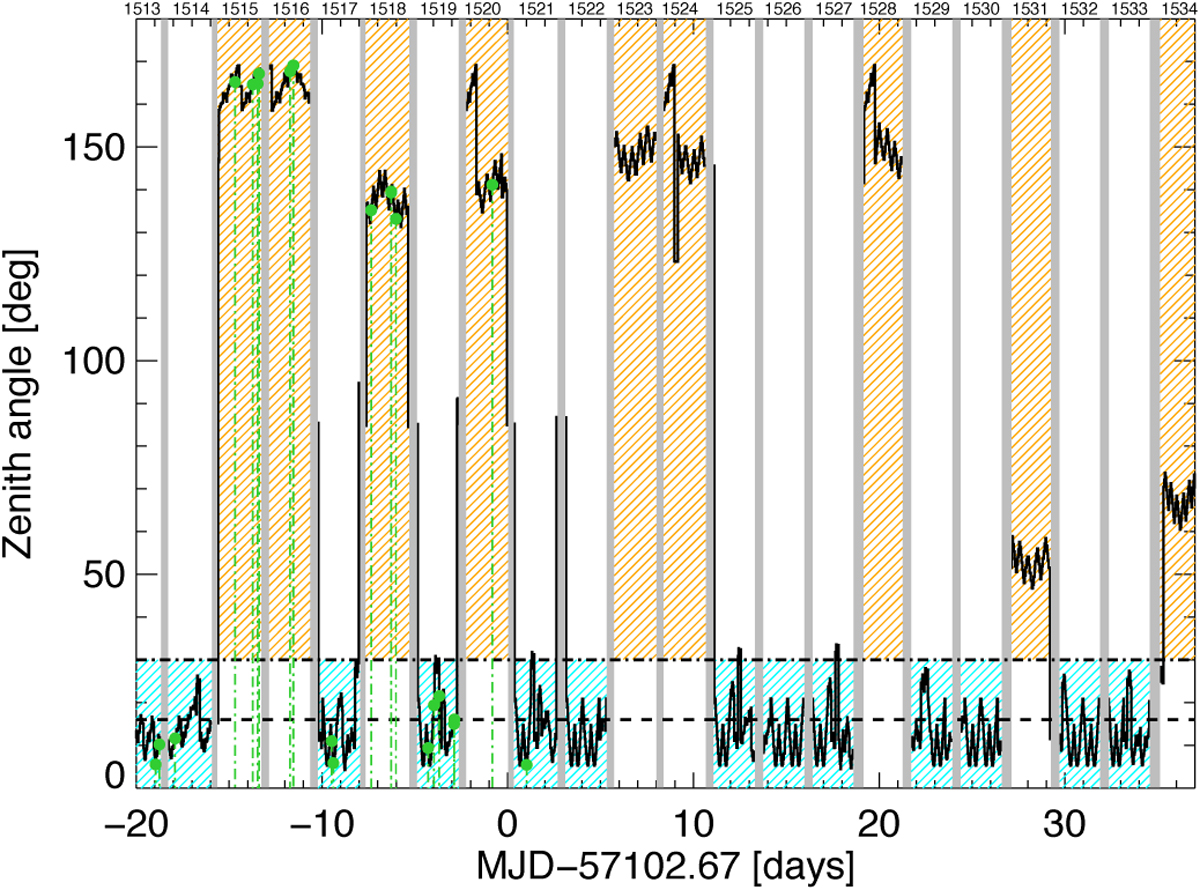
Position of V5668 Sgr (zenith angle, black data points) with respect to the SPI on-axis frame as a function of time in days from the nova optical maximum (MJD 57102.67). INTEGRAL revolution numbers are at the top. The black dashed and dot-dashed horizontal lines correspond to the SPI fully coded (16°) and partiallycoded (30°) field of view, respectively. The hatched cyan areas mark the times used for SPI on-axis analysis, whereas during the times marked by the orange hatched areas, off-axis analysis was performed using the ACS (see Sect. 2.3.2). The grey regions show the perigee passages of INTEGRAL, i.e. when no data is taken. The green dots indicate the times when the SPI-ACS search for flash-like events found its candidates (see Sect. 2.2; all aspect angles have been used for this search, but only from day –20 to day +3).
Current usage metrics show cumulative count of Article Views (full-text article views including HTML views, PDF and ePub downloads, according to the available data) and Abstracts Views on Vision4Press platform.
Data correspond to usage on the plateform after 2015. The current usage metrics is available 48-96 hours after online publication and is updated daily on week days.
Initial download of the metrics may take a while.