Fig. 13
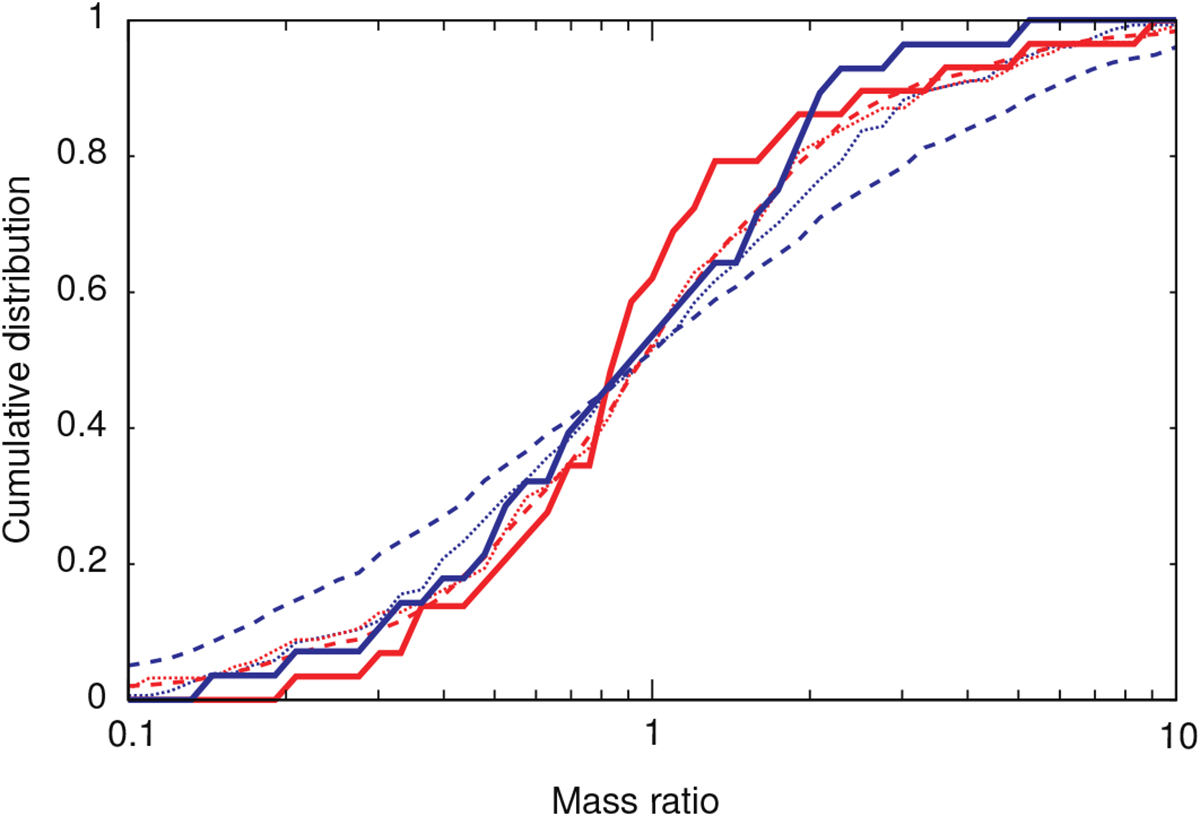
Cumulative distribution of mass ratio. Red and blue lines indicate results for model1 and model2, respectively. Solid lines are as in Fig. 7, while dashed lines show cumulative distributions for all pairs of planets that formed ten runs of simulations for each model. Dotted lines represent cumulative distributions for all pairs from the same simulation (one simulation).
Current usage metrics show cumulative count of Article Views (full-text article views including HTML views, PDF and ePub downloads, according to the available data) and Abstracts Views on Vision4Press platform.
Data correspond to usage on the plateform after 2015. The current usage metrics is available 48-96 hours after online publication and is updated daily on week days.
Initial download of the metrics may take a while.