Fig. B.3
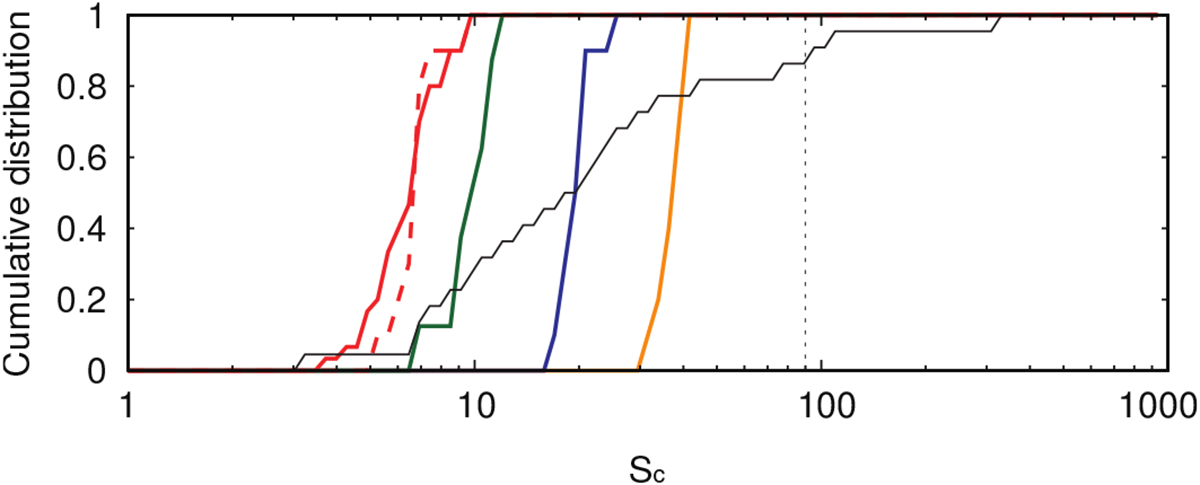
Cumulative distributions of a mass concentration statistic Sc. The black line indicates the distribution for 23 close-in super-Earth systems. Red, red dashed, green, blue, and orange linesrepresent results for model1, model3, model7, model8, model9, respectively. The vertical dashed line at Sc = 89.9 corresponds to the terrestrial planets of the solar system.
Current usage metrics show cumulative count of Article Views (full-text article views including HTML views, PDF and ePub downloads, according to the available data) and Abstracts Views on Vision4Press platform.
Data correspond to usage on the plateform after 2015. The current usage metrics is available 48-96 hours after online publication and is updated daily on week days.
Initial download of the metrics may take a while.