Fig. 5
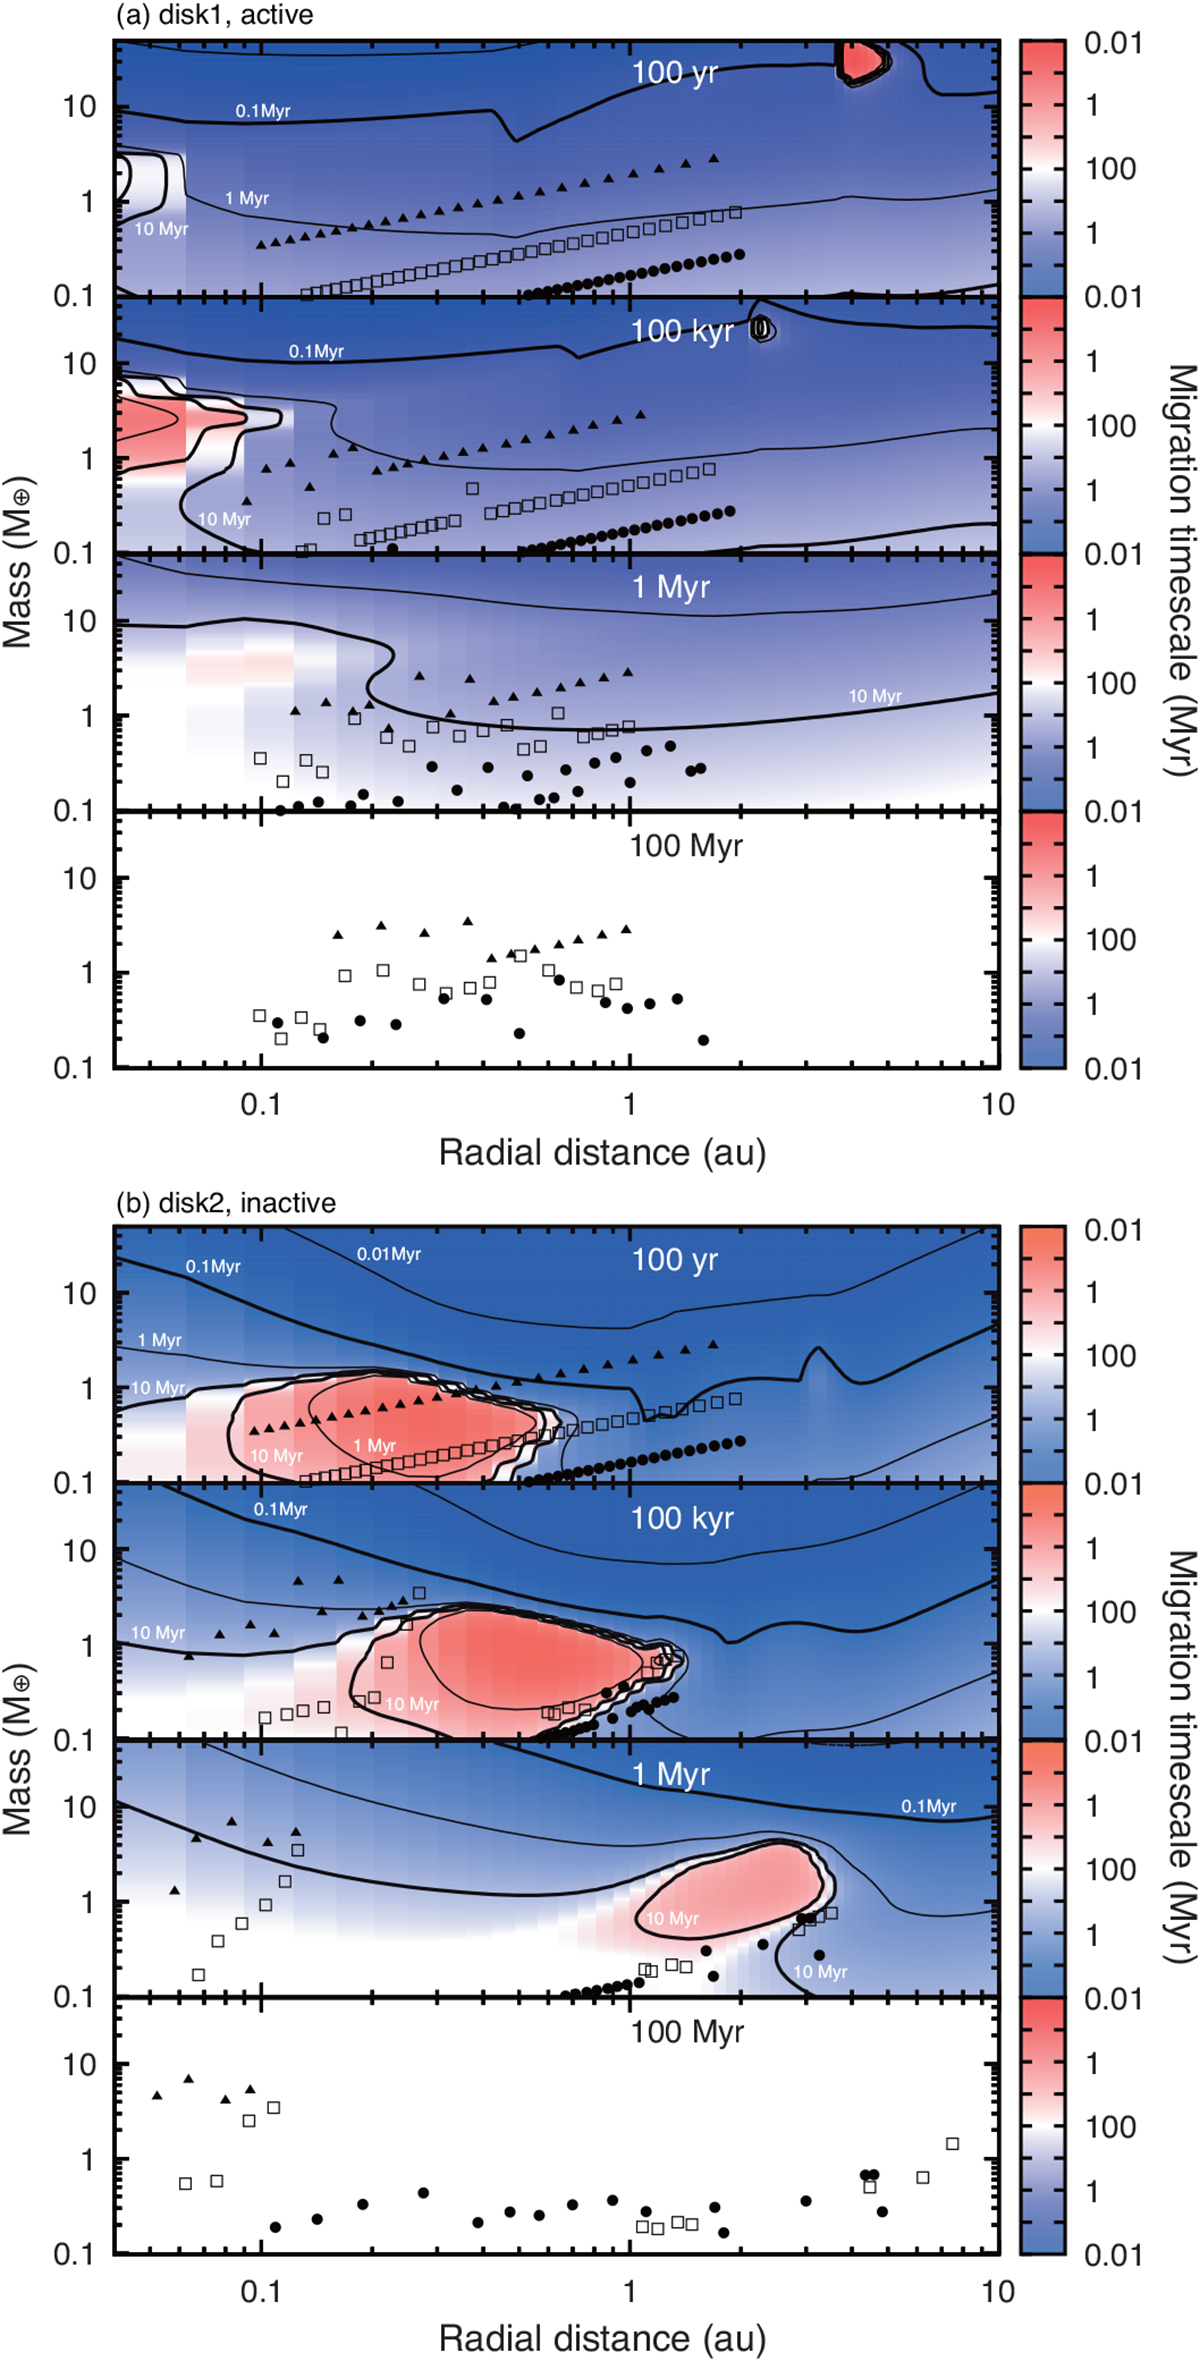
Migration maps for disk1 model panel a and disk2 model panel b. The color indicates the migration timescale which is calculated using Paardekooper et al. (2011). In the blue region, particles migrate inward, while they undergo outward migration in the red region. Snapshots of simulations are overplotted by filled circles (Σ0 = 15), open squares (Σ0 = 30), and filled triangles (Σ0 = 75). When the disk has a flat slope (panel a), the type I migration can be significantly suppressed.
Current usage metrics show cumulative count of Article Views (full-text article views including HTML views, PDF and ePub downloads, according to the available data) and Abstracts Views on Vision4Press platform.
Data correspond to usage on the plateform after 2015. The current usage metrics is available 48-96 hours after online publication and is updated daily on week days.
Initial download of the metrics may take a while.