Fig. 7
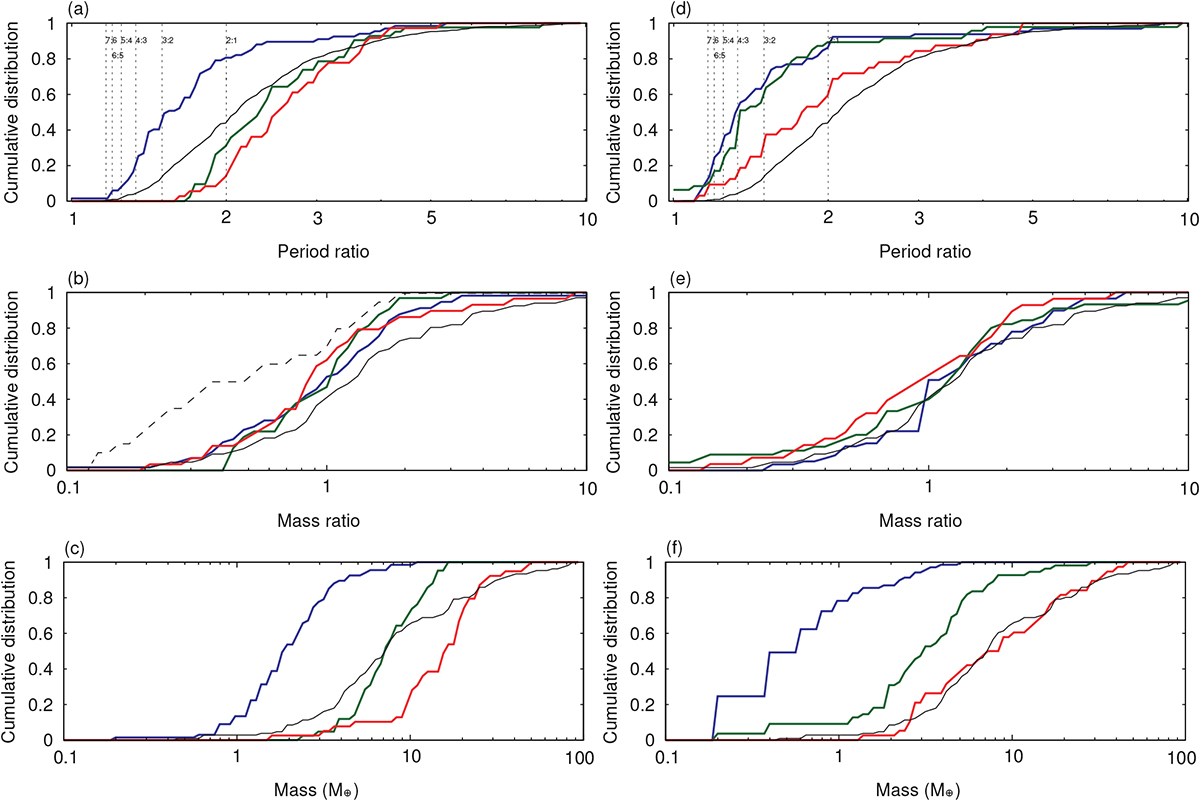
Cumulative distributions of final orbital configuration. Panel a: period ratio of adjacent pair (Pout ∕Pin), in which vertical lines indicate locations of first-order mean-motion resonances (MMRs). Panel b: mass ratio Mout ∕Min. Panel c: planetary mass distribution. Black solid lines in each panel represent observed distributions of close-in super-Earths. Red, green, and blue lines indicate results for model1, model3, and model4 in MRI-active disks, respectively. Black dashed line in panel b: result of Ogihara et al. (2015a) for a power-law disk based on the MMSN. Panels d–f are same as panels a–c but for MRI-inactive disks. Red, green, and blue lines in panels d–f indicate results for model2, model5, andmodel6, respectively.
Current usage metrics show cumulative count of Article Views (full-text article views including HTML views, PDF and ePub downloads, according to the available data) and Abstracts Views on Vision4Press platform.
Data correspond to usage on the plateform after 2015. The current usage metrics is available 48-96 hours after online publication and is updated daily on week days.
Initial download of the metrics may take a while.