Fig. 8.
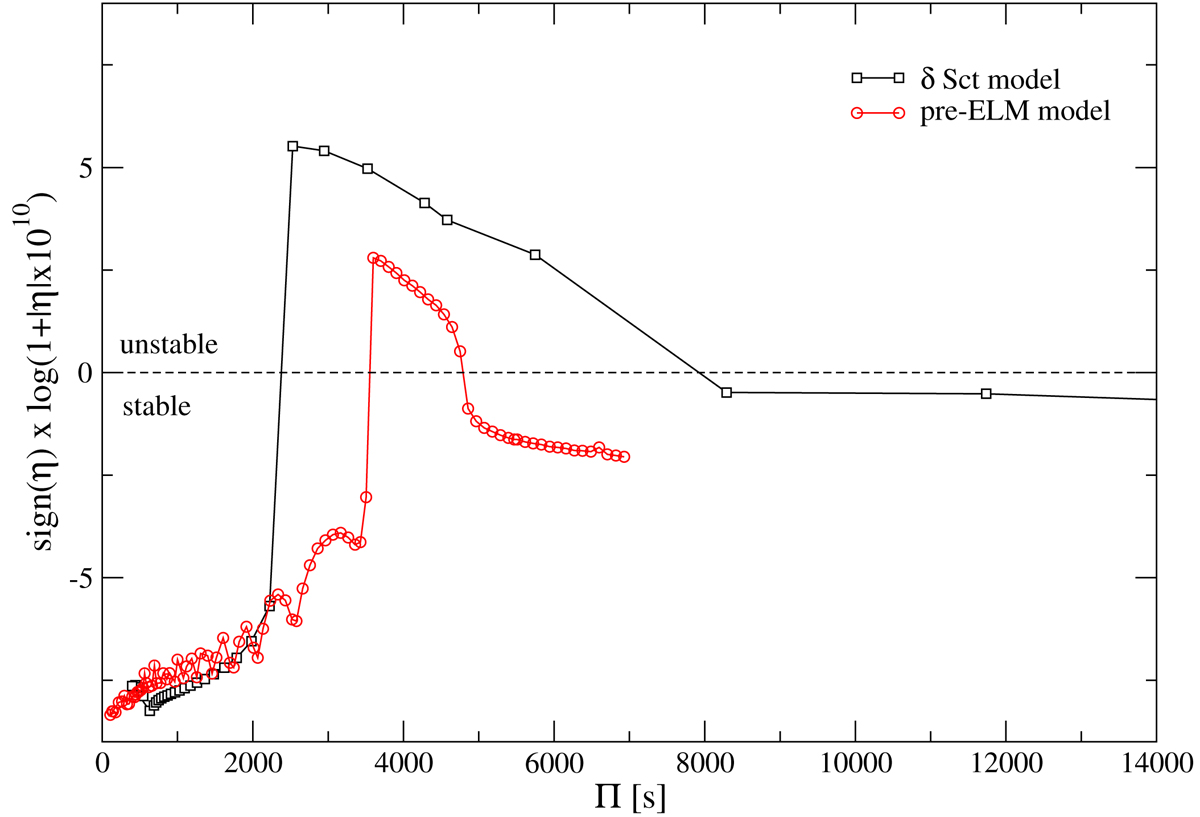
Normalized growth rates η for p and g modes in terms of the pulsation periods corresponding to the selected models. Modes corresponding the δ Sct model are depicted with square symbols and continuous black line, while modes corresponding to the pre-ELM WD model are depicted with circle symbols and continuous red lines. A value of η > 0 (η < 0) implies unstable (stable) modes. In frequencies, the band of excited modes for the δ Sct model is 10.16 ≲ v ≲ 34.56 c/d and for the pre-ELMV model is 17.28 ≲ v ≲ 24.68 c/d.
Current usage metrics show cumulative count of Article Views (full-text article views including HTML views, PDF and ePub downloads, according to the available data) and Abstracts Views on Vision4Press platform.
Data correspond to usage on the plateform after 2015. The current usage metrics is available 48-96 hours after online publication and is updated daily on week days.
Initial download of the metrics may take a while.