Fig. 10
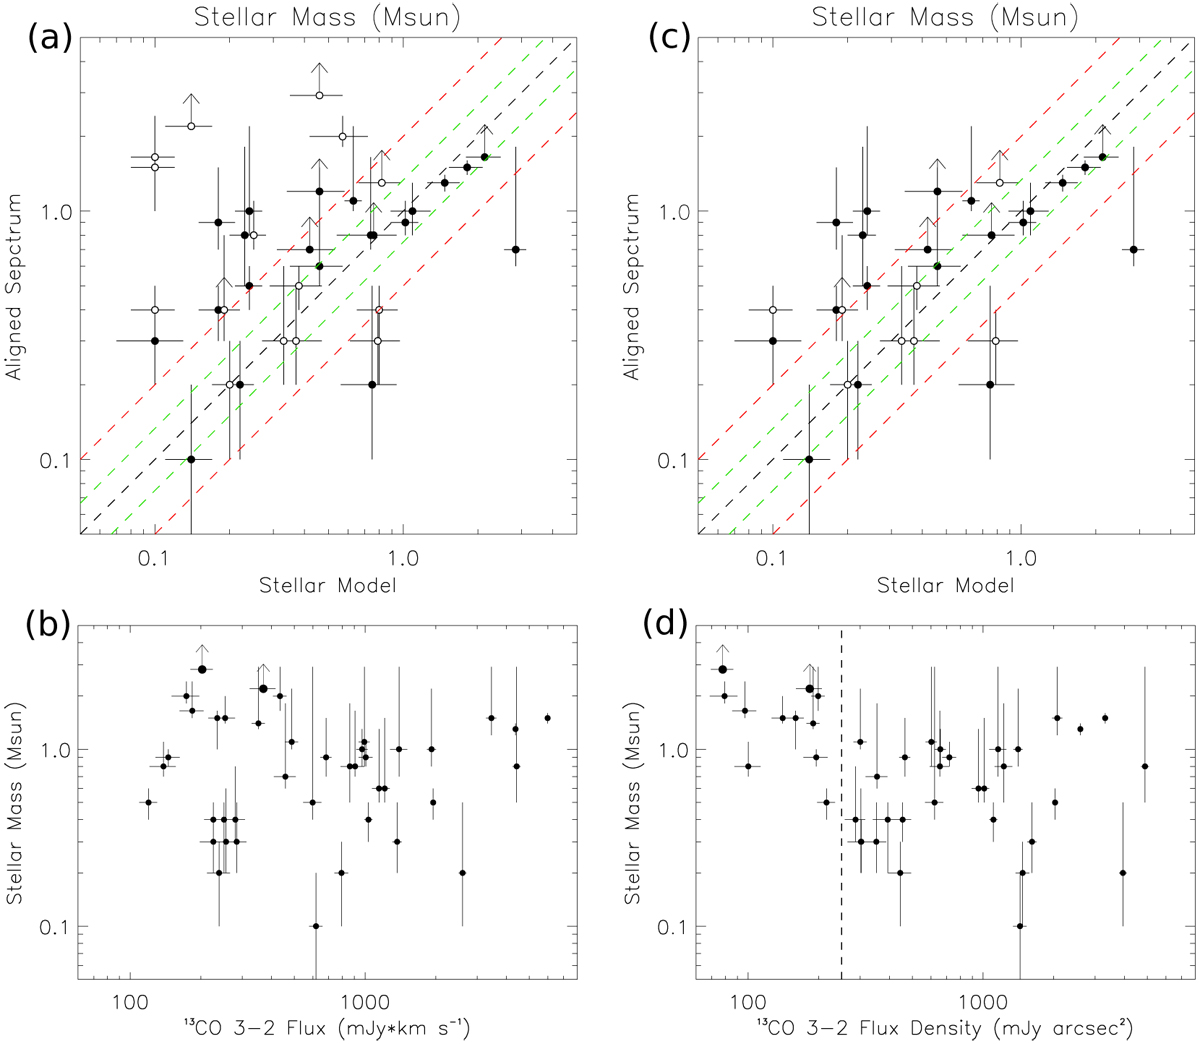
Panel a: stellar masses estimated with the spectroscopic method (horizontal axis; Alcalá et al. 2014, 2017) and with the dynamical information traced by the 13CO emission from this work (vertical axis). Filled and open symbols present the disks with the integrated 13CO fluxes above and below 400 mJy km s−1, respectively.Black, green, and red dashed lines denote the regions where the differences in mass are 0%, 25%, and 50%, respectively. Panel b: stellar masses estimated with the dynamical information from this work (vertical axis) compared with measured integrated 13CO fluxes (horizontal axis). Panel c: as in panel a but with a subsample of lowest 13CO flux density discarded. Panel d: as in panel b but the horizontal axis presents 13CO flux density. A vertical dashed line in (panel d) denotes our selection criterion for the subsample shown in panel c.
Current usage metrics show cumulative count of Article Views (full-text article views including HTML views, PDF and ePub downloads, according to the available data) and Abstracts Views on Vision4Press platform.
Data correspond to usage on the plateform after 2015. The current usage metrics is available 48-96 hours after online publication and is updated daily on week days.
Initial download of the metrics may take a while.