Fig. A.1
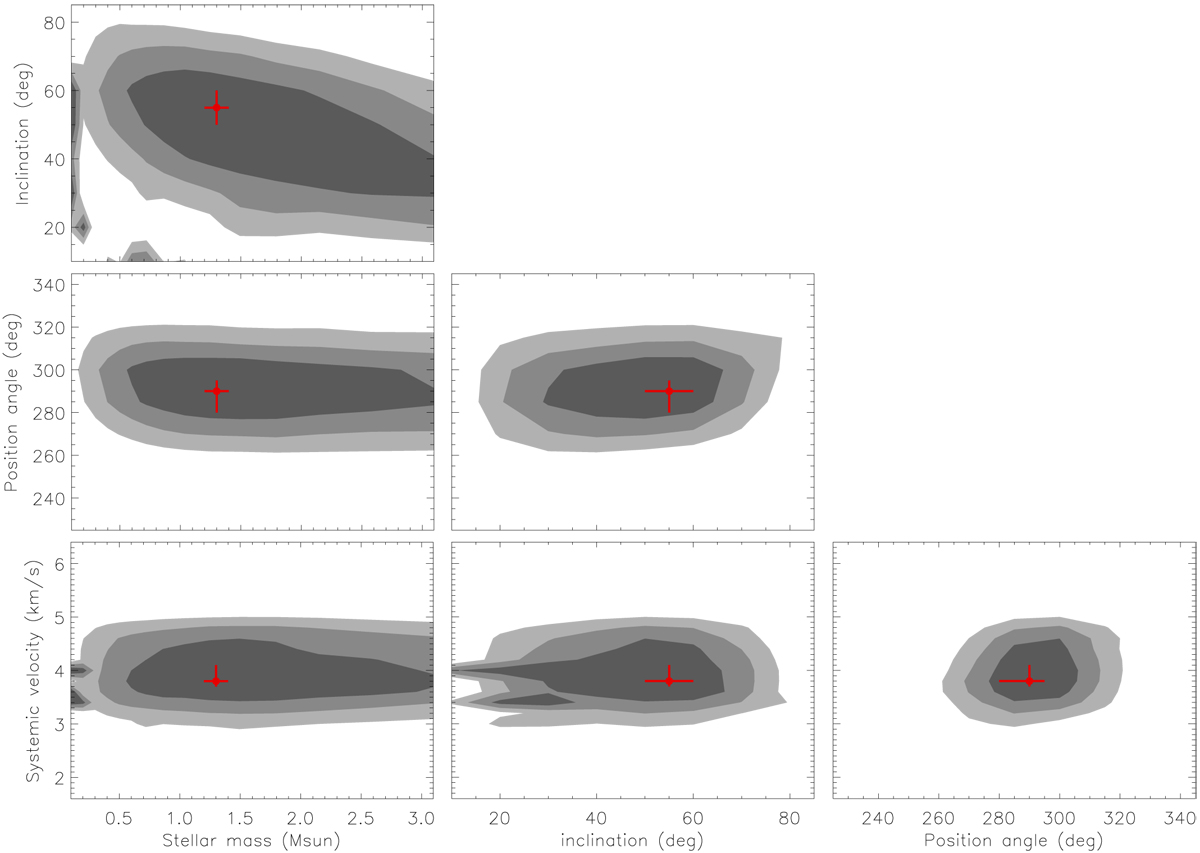
Highest S/Ns of the weighted integrated intensity of the aligned stacked spectra achieved with a given pair of the parameters by varying the other two parameters for RY Lup. Contours from higher (dark) to lower (light) levels delineate the parameter space with achieved S/Ns of the maximum S/N − 1, − 2, and − 3. Red data points with error bars show our measurements and uncertainties reported in Table 1. The uncertainties are smaller than the parameter ranges delineated by the maximum S/N − 1 contour because of the additional constraints from the line profiles (see Sect. 3).
Current usage metrics show cumulative count of Article Views (full-text article views including HTML views, PDF and ePub downloads, according to the available data) and Abstracts Views on Vision4Press platform.
Data correspond to usage on the plateform after 2015. The current usage metrics is available 48-96 hours after online publication and is updated daily on week days.
Initial download of the metrics may take a while.