Fig. 3
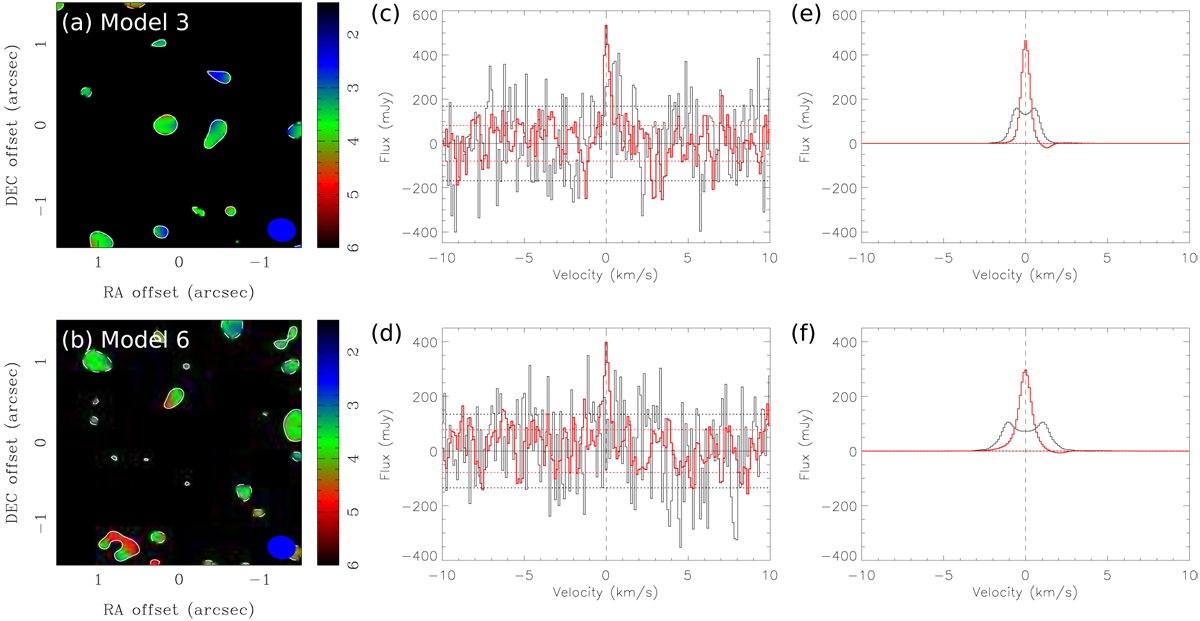
Synthetic images and spectra of disk model 3 (top row) and 6 (bottom row). The model parameters are listed in Table C.1. Panels a and b: moment 0 maps (contour) overlaid on the moment 1 maps (color; in units of km s−1) of the model disks. The moment 0 and 1 maps were computed by integrating the velocity range of VLSR = 3.7 ± 2.3 km s−1, the same as in Ansdell et al. (2016). Contour levels start from 2σ in steps of 2σ, where 1σ is 56 mJy km s−1. Panels c and d: synthetic stacked spectra with the alignment using the measured parameters (red) overlaid on the ones without alignment (black). Both are integrated over the disk area. Zero velocity refers to the measured Vsys. Red and black horizontal dotted lines denote ±1σ levels with and without alignment, respectively. Panels e and f: as in panelsc and d but for synthetic spectra without noise. Black histograms present the stacked spectrum without alignment, and red histograms present the stacked spectrum with the alignment using the input parameters.
Current usage metrics show cumulative count of Article Views (full-text article views including HTML views, PDF and ePub downloads, according to the available data) and Abstracts Views on Vision4Press platform.
Data correspond to usage on the plateform after 2015. The current usage metrics is available 48-96 hours after online publication and is updated daily on week days.
Initial download of the metrics may take a while.