Fig. 7
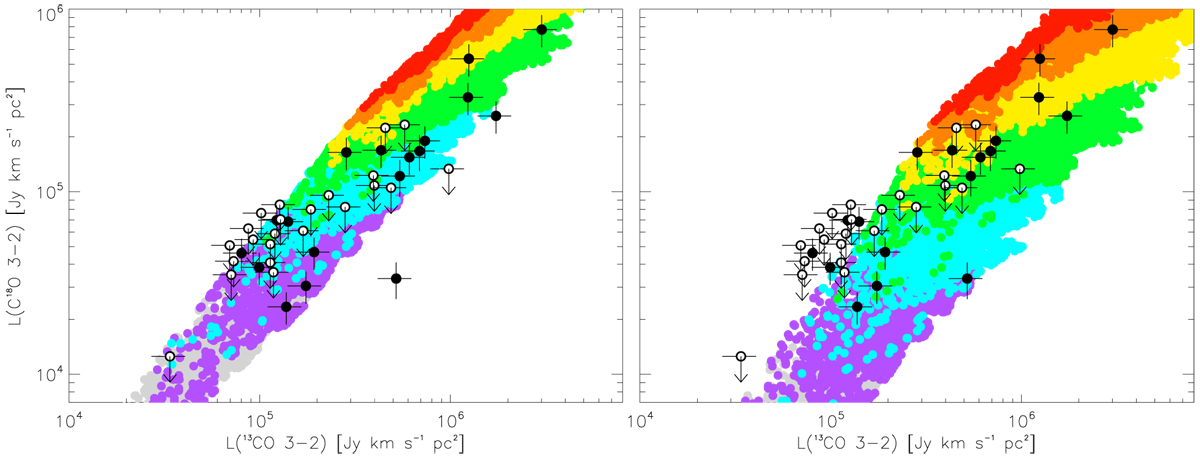
13CO (horizontal axis) and C18O (vertical axis) line luminosities from the physical–chemical models of protoplanetary disks (color dots) by Williams & Best (2014) overlaid on the measured line luminosities from the velocity-aligned stacking method (data points with error bars). The C18O non-detected disks are presented with open circles. Red, orange, yellow, green, blue, purple, and gray dots denote the models with disk masses of 10−1, 3 × 10⁻², 10−2, 3 × 10⁻³, 10−3, 3 × 10⁻⁴, and 10−4 M⊙. The left panel is for the typical ISM abundance of C18O, while the right panel is for the C18O abundance that is three times lower the typical value.
Current usage metrics show cumulative count of Article Views (full-text article views including HTML views, PDF and ePub downloads, according to the available data) and Abstracts Views on Vision4Press platform.
Data correspond to usage on the plateform after 2015. The current usage metrics is available 48-96 hours after online publication and is updated daily on week days.
Initial download of the metrics may take a while.