Free Access
Fig. 1.
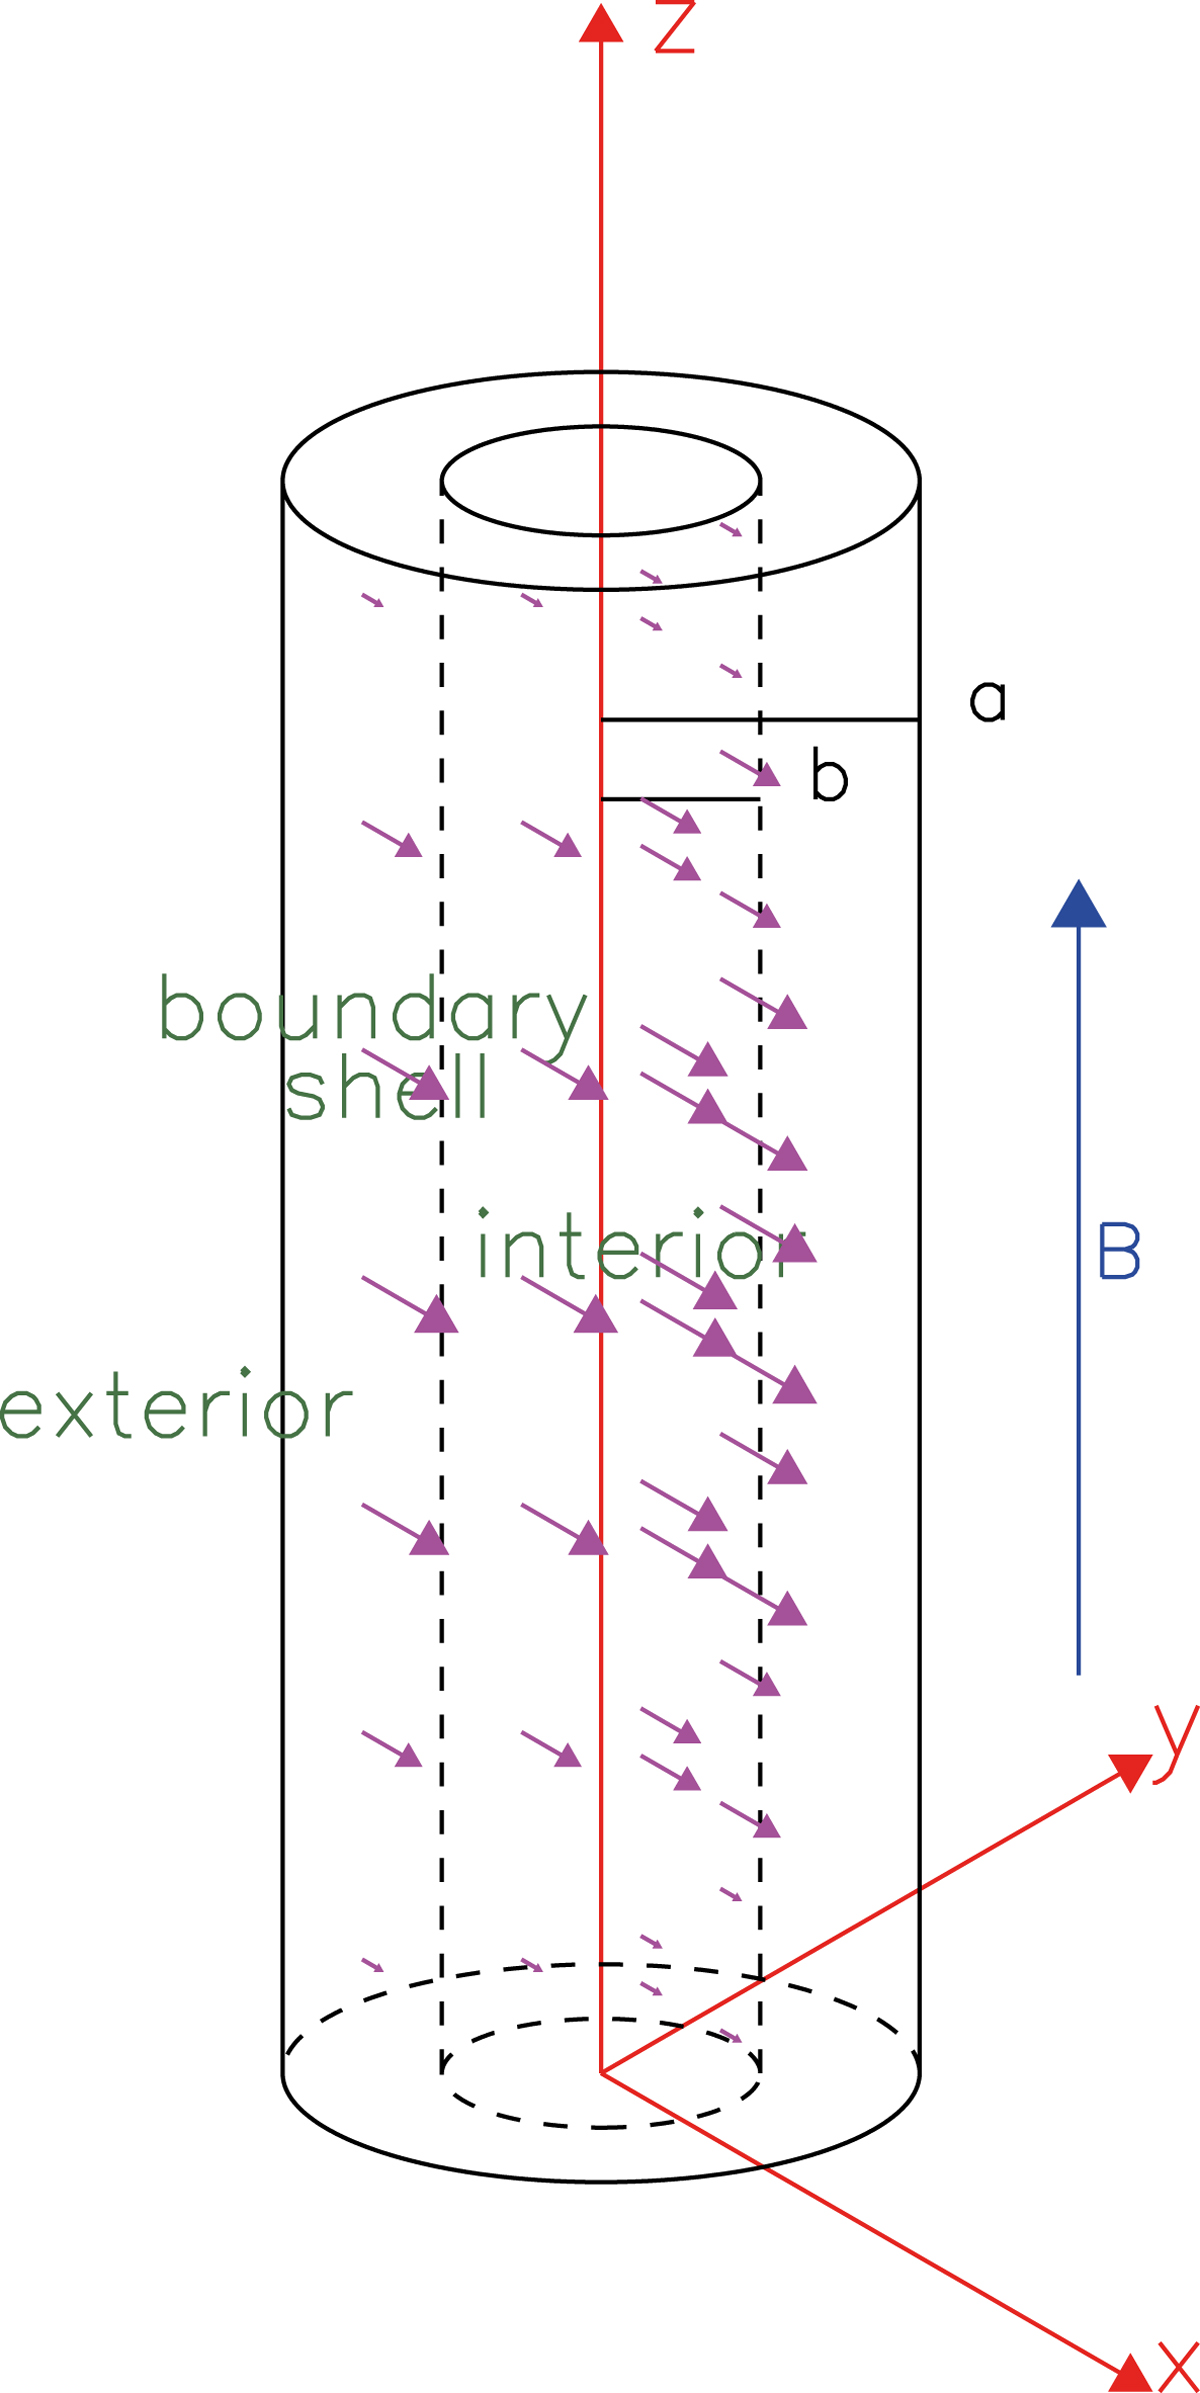
Sketch to illustrate the geometry of our system and the Cartesian axes (red arrows). The blue arrow represents the direction of the magnetic field and the magenta arrows represent the plasma velocity vectors associated with a kink oscillation. The black lines identify the different regions of the loop.
Current usage metrics show cumulative count of Article Views (full-text article views including HTML views, PDF and ePub downloads, according to the available data) and Abstracts Views on Vision4Press platform.
Data correspond to usage on the plateform after 2015. The current usage metrics is available 48-96 hours after online publication and is updated daily on week days.
Initial download of the metrics may take a while.