Free Access
Fig. 5.
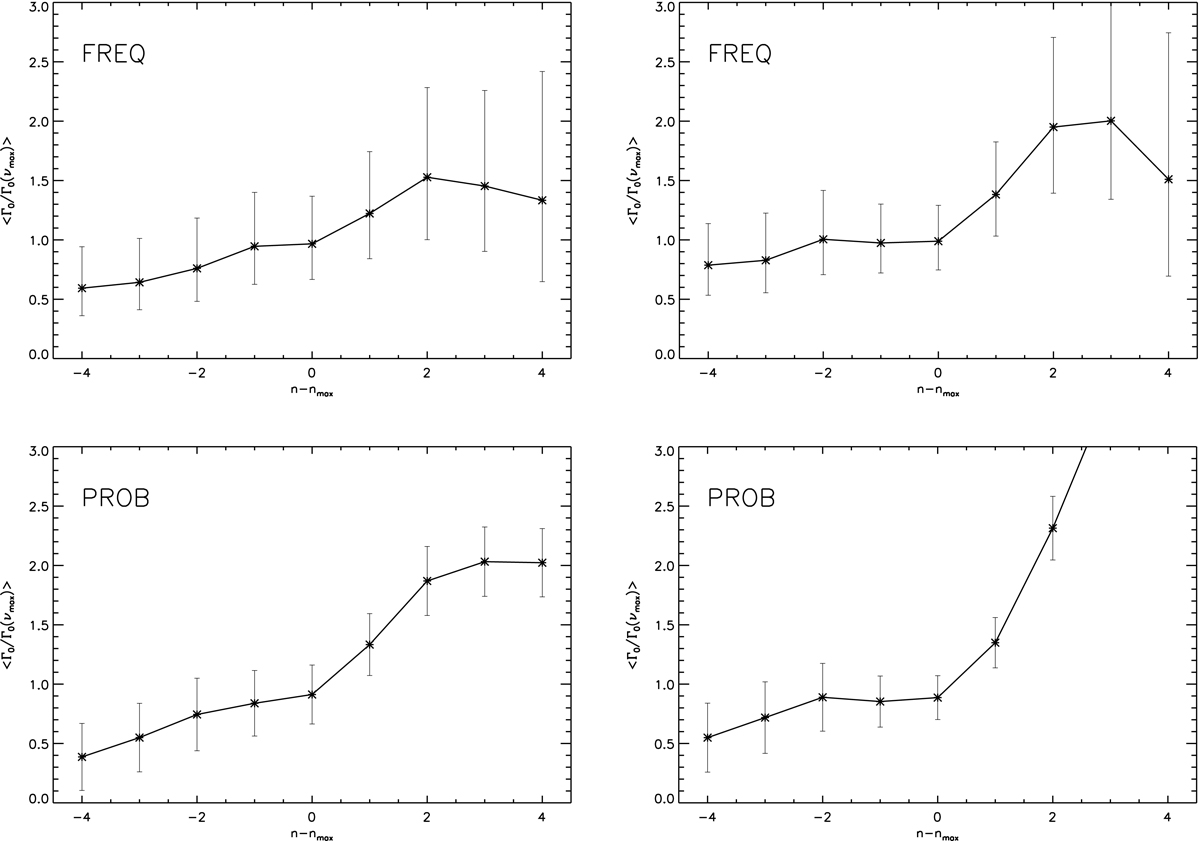
Collapsogram of the relative radial mode width as a function of the radial mode order n − nmax for the FREQ method (top) and for the PROB method (bottom). Clump and RGB stars are shown in the left and right panels, respectively. The error bars correspond to the 1σ uncertainties.
Current usage metrics show cumulative count of Article Views (full-text article views including HTML views, PDF and ePub downloads, according to the available data) and Abstracts Views on Vision4Press platform.
Data correspond to usage on the plateform after 2015. The current usage metrics is available 48-96 hours after online publication and is updated daily on week days.
Initial download of the metrics may take a while.