Fig. 10.
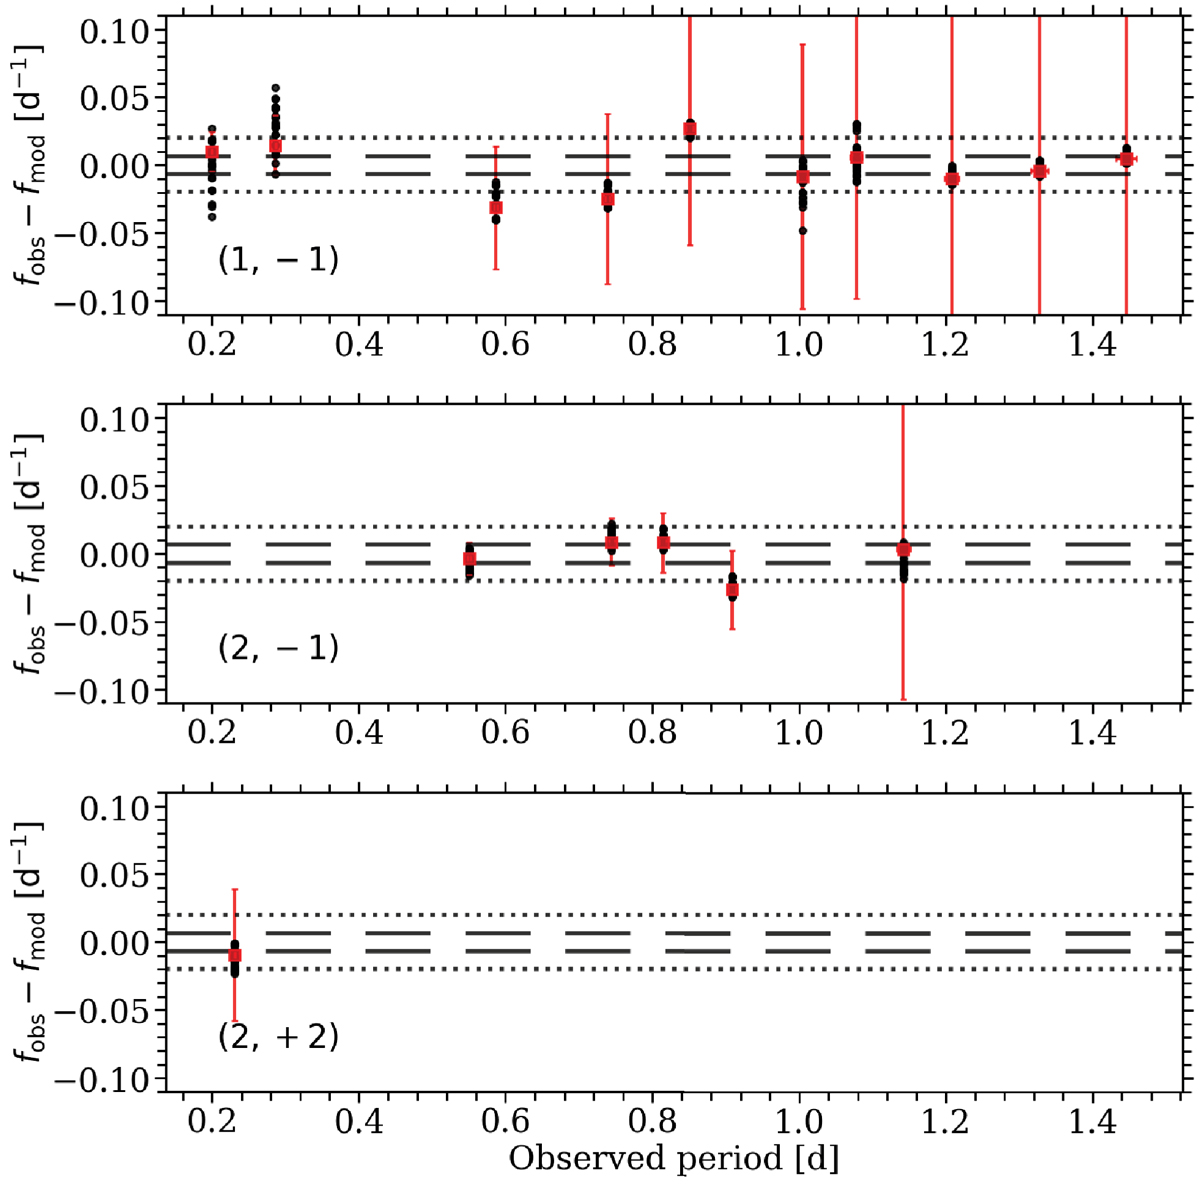
Difference in frequency between the observed pulsation mode frequencies and the GYRE frequencies of the 20 best MESA models, ordered according to the mode geometry. The red squares indicate the difference between the observations and the best model description. The red vertical error bars indicate the frequency shift caused by an internal poloidal magnetic field of 82.4 kG and the red horizontal error bars represent the Rayleigh frequency resolution of the CoRoT light curve; both were often similar to the symbol size, while the magnetic frequency shift for the highest period dipole modes was larger than the indicated panel (see also Table 3). The black dashed and dotted lines show the Rayleigh frequency resolution and 3δfray, respectively.
Current usage metrics show cumulative count of Article Views (full-text article views including HTML views, PDF and ePub downloads, according to the available data) and Abstracts Views on Vision4Press platform.
Data correspond to usage on the plateform after 2015. The current usage metrics is available 48-96 hours after online publication and is updated daily on week days.
Initial download of the metrics may take a while.